最近项目上需要用流程图来做问题定界分析,之前有同事用jsPlumb做过,但是阅读代码后觉得比较麻烦,所以自己又找了一圈,找到一个叫Dagre-D3的开源类库,画出来的效果如下图,Dagre-D3最大的优点就是可以实现自动布局,你只需要put数据就可以了,但是缺点就是自动布局后的连线会比较乱,而且连线不是横平竖直的,对于流程图不复杂的还好,稍微复杂点画出来的连线就没法看。最后还是被pass了。
jsPlumb地址:https://jsplumbtoolkit.com
Dagre-D3 Git地址:https://github.com/cpettitt/dagre-d3
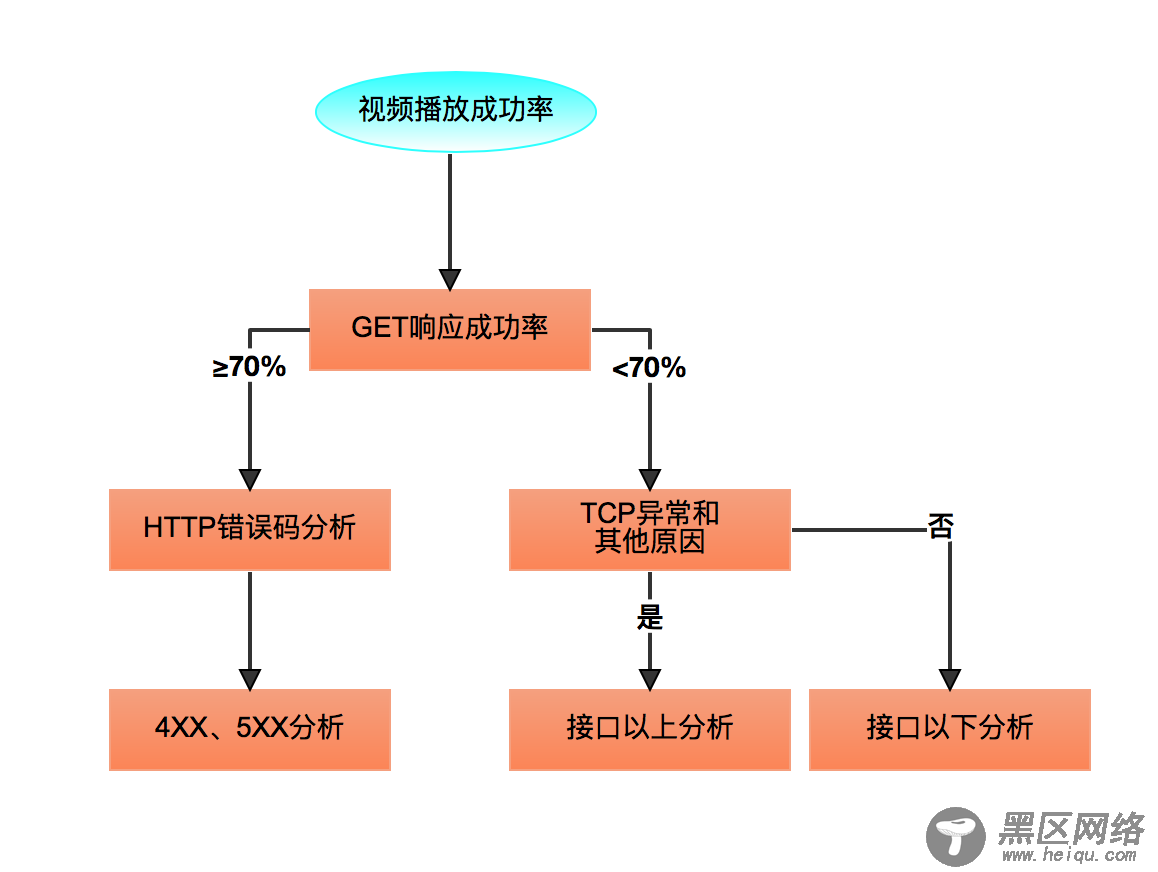
后面经过一番百度,最终决定用JointJS,官网:,相比Dagre-D3和jsPlumb,JointJS的API很详细,代码量少,连接线有多种选择,封装了多种常用的形状,而且能画的图很多,官方也给了一些demo可以参考。下面是我用JointJS画出来的流程图:
依赖:在官网的下载页面都能找到
<link type="text/css" href="https://www.jb51.net/joint.css" /> <script src="https://www.jb51.net/jquery.min.js"></script> <script src="https://www.jb51.net/lodash.min.js"></script> <script src="https://www.jb51.net/backbone-min.js"></script> <script src="https://www.jb51.net/joint.js"></script>
我的demo里还引用了bootstrap的依赖用来显示模态框
html代码
<body> <div></div> <div tabindex="-1" role="dialog" aria-labelledby="myModalLabel"> <div role="document"> <div> <div> <button type="button" data-dismiss="modal" aria-label="Close"><span aria-hidden="true">×</span></button> <h4>详细信息</h4> </div> <div> </div> <div> <button type="button" data-dismiss="modal">关闭</button> </div> </div> </div> </div> </body>
js代码
首先是定义画板和画布,这里重写了ElementView和LinkView,目的是为了让画出来的流程图不能被删除和编辑
var graph = new joint.dia.Graph(); var ElementView = joint.dia.ElementView.extend({ pointerdown: function () { this._click = true; joint.dia.ElementView.prototype.pointerdown.apply(this, arguments); }, pointermove: function(evt, x, y) { this._click = false; joint.dia.ElementView.prototype.pointermove.apply(this, arguments); }, pointerup: function (evt, x, y) { if (this._click) { // triggers an event on the paper and the element itself this.notify('cell:click', evt, x, y); } else { joint.dia.ElementView.prototype.pointerup.apply(this, arguments); } } }); var LinkView = joint.dia.LinkView.extend({ addVertex: function(evt, x, y) {}, removeVertex: function(endType) {}, pointerdown:function(evt, x, y) {} }); //定义画布 var paper = new joint.dia.Paper({ el: $('#paper'), width: 1200, height: 600, gridSize: 1, model: graph, elementView: ElementView, linkView:LinkView }); //paper.$el.css('pointer-events', 'none')//去除默认样式,使所有事件不可用
然后我写了两个函数分别用来创建形状和连线,这样写可以减少代码量,官方的demo也大都是这样写的
//定义形状 var state = function(x, y, shape, background, text){ var cell; if(shape==="rect"){ cell = new joint.shapes.basic.Rect({ position: { x: x, y: y },//坐标 size: { width: 140, height: 40 },//宽高 attrs: { rect: { fill: { type: 'linearGradient', stops: [ { offset: '0%', color: background },//渐变开始 { offset: '100%', color: '#fe8550' }//渐变结束 ], attrs: { x1: '0%', y1: '0%', x2: '0%', y2: '100%' } }, stroke: background,//边框颜色 'stroke-width': 1//边框大小 }, text: { text: text } //显示文字 } }); } else if(shape==="ellipse"){ cell = new joint.shapes.basic.Ellipse({ position: { x: x, y: y },//坐标 size: { width: 140, height: 40 },//宽高 attrs: { ellipse: { fill: { type: 'linearGradient', stops: [ { offset: '0%', color: background },//渐变开始 { offset: '100%', color: '#FFFFFF' }//渐变结束 ], attrs: { x1: '0%', y1: '0%', x2: '0%', y2: '100%' } }, stroke: background,//边框颜色 'stroke-width': 1//边框大小 }, text: { text: text } //显示文字 } }); } graph.addCell(cell); return cell; }; //定义连线 function link(source, target, label){ var cell = new joint.dia.Link({ source: { id: source.id }, target: { id: target.id }, labels: [{ position: 0.5, attrs: { text: { text: label || '', 'font-weight': 'bold' } } }], router: { name: 'manhattan' },//设置连线弯曲样式 manhattan直角 attrs: { '.connection': { stroke: '#333333',//连线颜色 'stroke-width': 2//连线粗细 }, '.marker-target': { fill: '#333333',//箭头颜色 d: 'M 10 0 L 0 5 L 10 10 z'//箭头样式 } } }); graph.addCell(cell); return cell; }