Matlab工程中,经常要产生测试数据,比如特定包含噪声的曲线。以下是Matlab实现的通过鼠标拾取坐标点,然后生成包含直线和圆弧的x,y坐标的代码。
操作方式:鼠标拾取一个起点,弹出选择菜单,选择直线或者圆弧,选择直线后,鼠标拾取第二个点;选择圆弧之后,鼠标拾取另外两个点,通过三个点拟合圆弧并生成圆弧数据。
主文件:
clc,clear,close all% figure axis([0 1000 0 1000])%坐标轴大小 axis square x_out=[];y_out=[];%保存所有生成的数据 xy0=ginput(1);%起点 temp_xy=xy0;%上一次拾取的点 plot(xy0(1),xy0(2),'*') axis([0 1000 0 1000]),hold on axis square n=4;%曲线的段数 for i=1:n res=menu('选择','直线','圆弧'); if(res==1) %disp(['选择的是直线']) xy1=ginput(1); [x,y]=drawLine(temp_xy,xy1); x_out=[x_out x];y_out=[y_out y]; temp_xy=xy1(end,:); plot(x,y); else %disp(['选择的是圆弧']) %注意圆弧y坐标唯一,即扇形角度不能超过180度 xy1=ginput(2); [x,y]=getArc(temp_xy,xy1(1,:),xy1(2,:)); x_out=[x_out x];y_out=[y_out y]; temp_xy=xy1(end,:); end end %加噪声 noise=2;%设定噪声幅度 for i=1:length(x_out) y_out(i)=y_out(i)+random('Normal',-1*noise,noise); end xy_file=[x_out' y_out'];%转置为两列 xy_file=sortrows(xy_file,1);%按x坐标(第一列)重排序,放置圆弧产生的顺序颠倒 xy_file=[xy_file(:,1)';xy_file(:,2)']%转置回两行坐标形式 figure plot(xy_file(1,:),xy_file(2,:)) %写入txt文件,文件名自动递增 count=1; fileName=['D:\data' num2str(count) '.txt']; if(exist(fileName,'file')) count=count+1; fileName=['D:\data' num2str(count) '.txt']; end fid=fopen(fileName,'wt'); fprintf(fid,'%f,%f\n',xy_file); fclose(fid);两点生成直线文件: %两点产生直线数据 function [x,y]=drawLine(A,B) x=A(1):0.1:B(1); y=(B(2)-A(2))/(B(1)-A(1))*(x-A(1))+A(2); end三点生成圆弧数据文件: %三点计算圆弧(画图) %数据A=[1 2]; %B=[5 6]; %C=[3 5]; function [x,y]=getArc(A,B,C) [c,r]=calcCircle(A,B,C); a=c(1); b=c(2); th=[A;B;C]; th2=[th(:,1)-a th(:,2)-b]; theta=atan2(th2(:,2),th2(:,1)); [theta_max,num_max]=max(theta); [theta_min,num_min]=min(theta); t=linspace(theta_min,theta_max,1000); %t=0:0.1:2*pi; a=c(1); b=c(2); x=r*cos(t)+a; y=r*sin(t)+b; plot(x,y,'r-',th(:,1),th(:,2),'o') %axis equal end
圆弧拟合文件(注:该文件来源于网络): function [centre radius] = calcCircle(pt1, pt2, pt3) % calcCircle: Fit a circle to a set of 3 points % % Inputs: % pt1, pt2 and pt3 are vectors with 2 elements representing a point % in 2D Cartesian coordinates. % % Returns: % The centre coordinate (2 elements) and radius of the circle. % A centre value of [0,0] and radius of -1 if the points are collinear. % % Example: % % p1 = rand(1,2); % p2 = rand(1,2); % p3 = rand(1,2); % % [c r] = calcCircle(p1, p2, p3); % % figure(1) % cla % axis equal % hold on % if r ~= -1 % rectangle('Position',[c(1)-r,c(2)-r,2*r,2*r],'Curvature',[1,1],'EdgeColor','g') % end % plot(p1(1), p1(2), '*') % plot(p2(1), p2(2), '*') % plot(p3(1), p3(2), '*') % % for Matlab R13 and up % version 1.2 (mar 2008) % Author: Peter Bone (email: peterbone@hotmail.com) % % History % Created: 6th March 2008, version 1.1 % Revisions % 7th March 2008: Version 1.2 for improved help and usability % argument checking if nargin < 3 error('Three input points are required.'); elseif ~isequal(numel(pt1),numel(pt2),numel(pt3),2) error('The three input points should all have two elements.') end pt1 = double(pt1); pt2 = double(pt2); pt3 = double(pt3); epsilon = 0.000000001; delta_a = pt2 - pt1; delta_b = pt3 - pt2; ax_is_0 = abs(delta_a(1)) <= epsilon; bx_is_0 = abs(delta_b(1)) <= epsilon; % check whether both lines are vertical - collinear if ax_is_0 && bx_is_0 centre = [0 0]; radius = -1; warning([mfilename ':CollinearPoints'],'Points are on a straight line (collinear).'); return end % make sure delta gradients are not vertical % swap points to change deltas if ax_is_0 tmp = pt2; pt2 = pt3; pt3 = tmp; delta_a = pt2 - pt1; end if bx_is_0 tmp = pt1; pt1 = pt2; pt2 = tmp; delta_b = pt3 - pt2; end grad_a = delta_a(2) / delta_a(1); grad_b = delta_b(2) / delta_b(1); % check whether the given points are collinear if abs(grad_a-grad_b) <= epsilon centre = [0 0]; radius = -1; warning([mfilename ':CollinearPoints'],'Points are on a straight line (collinear).'); return end % swap grads and points if grad_a is 0 if abs(grad_a) <= epsilon tmp = grad_a; grad_a = grad_b; grad_b = tmp; tmp = pt1; pt1 = pt3; pt3 = tmp; end % calculate centre - where the lines perpendicular to the centre of % segments a and b intersect. centre(1) = ( grad_a*grad_b*(pt1(2)-pt3(2)) + grad_b*(pt1(1)+pt2(1)) - grad_a*(pt2(1)+pt3(1)) ) / (2*(grad_b-grad_a)); centre(2) = ((pt1(1)+pt2(1))/2 - centre(1)) / grad_a + (pt1(2)+pt2(2))/2; % calculate radius radius = norm(centre - pt1);
部分截图:
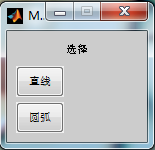
选择菜单:
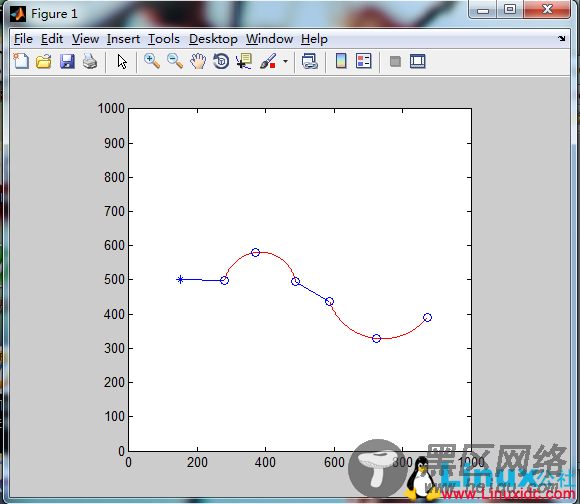
鼠标拾取即时画图:
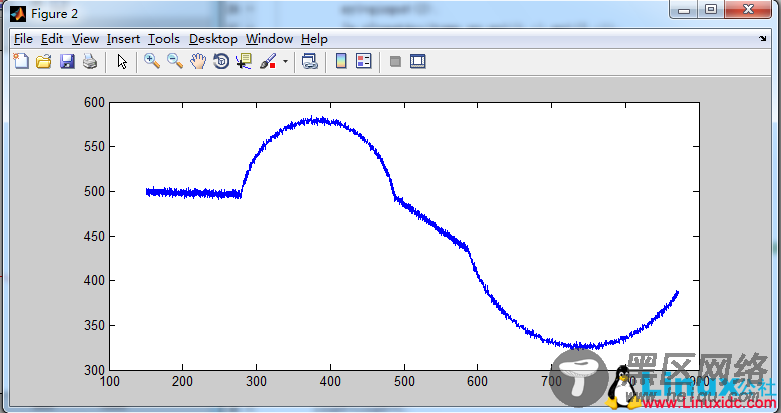
生成的数据重新画图:
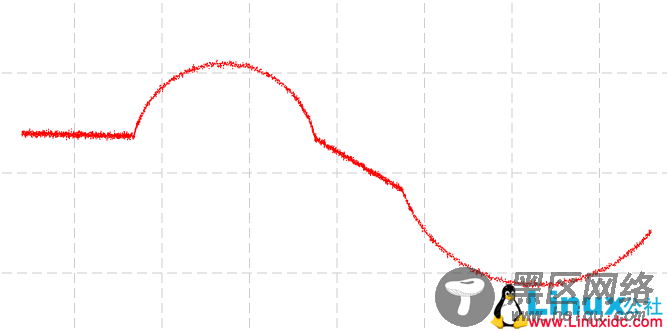
自己的工程导入后效果:
生成的数据文件: