用Python画图的时候选色选点都可以直接参考这里的内容,matplotlib中有哪些命名颜色可供用于绘图? 在matplotlib文档中找到一个列表,声明这些是唯一的名称:
b: blue
g: green
r: red
c: cyan
m: magenta
y: yellow
k: black
w: white
然而,我发现这些颜色也可以使用,至少在这种情况下:
scatter(X,Y, color='red')
scatter(X,Y, color='orange')
scatter(X,Y, color='darkgreen')
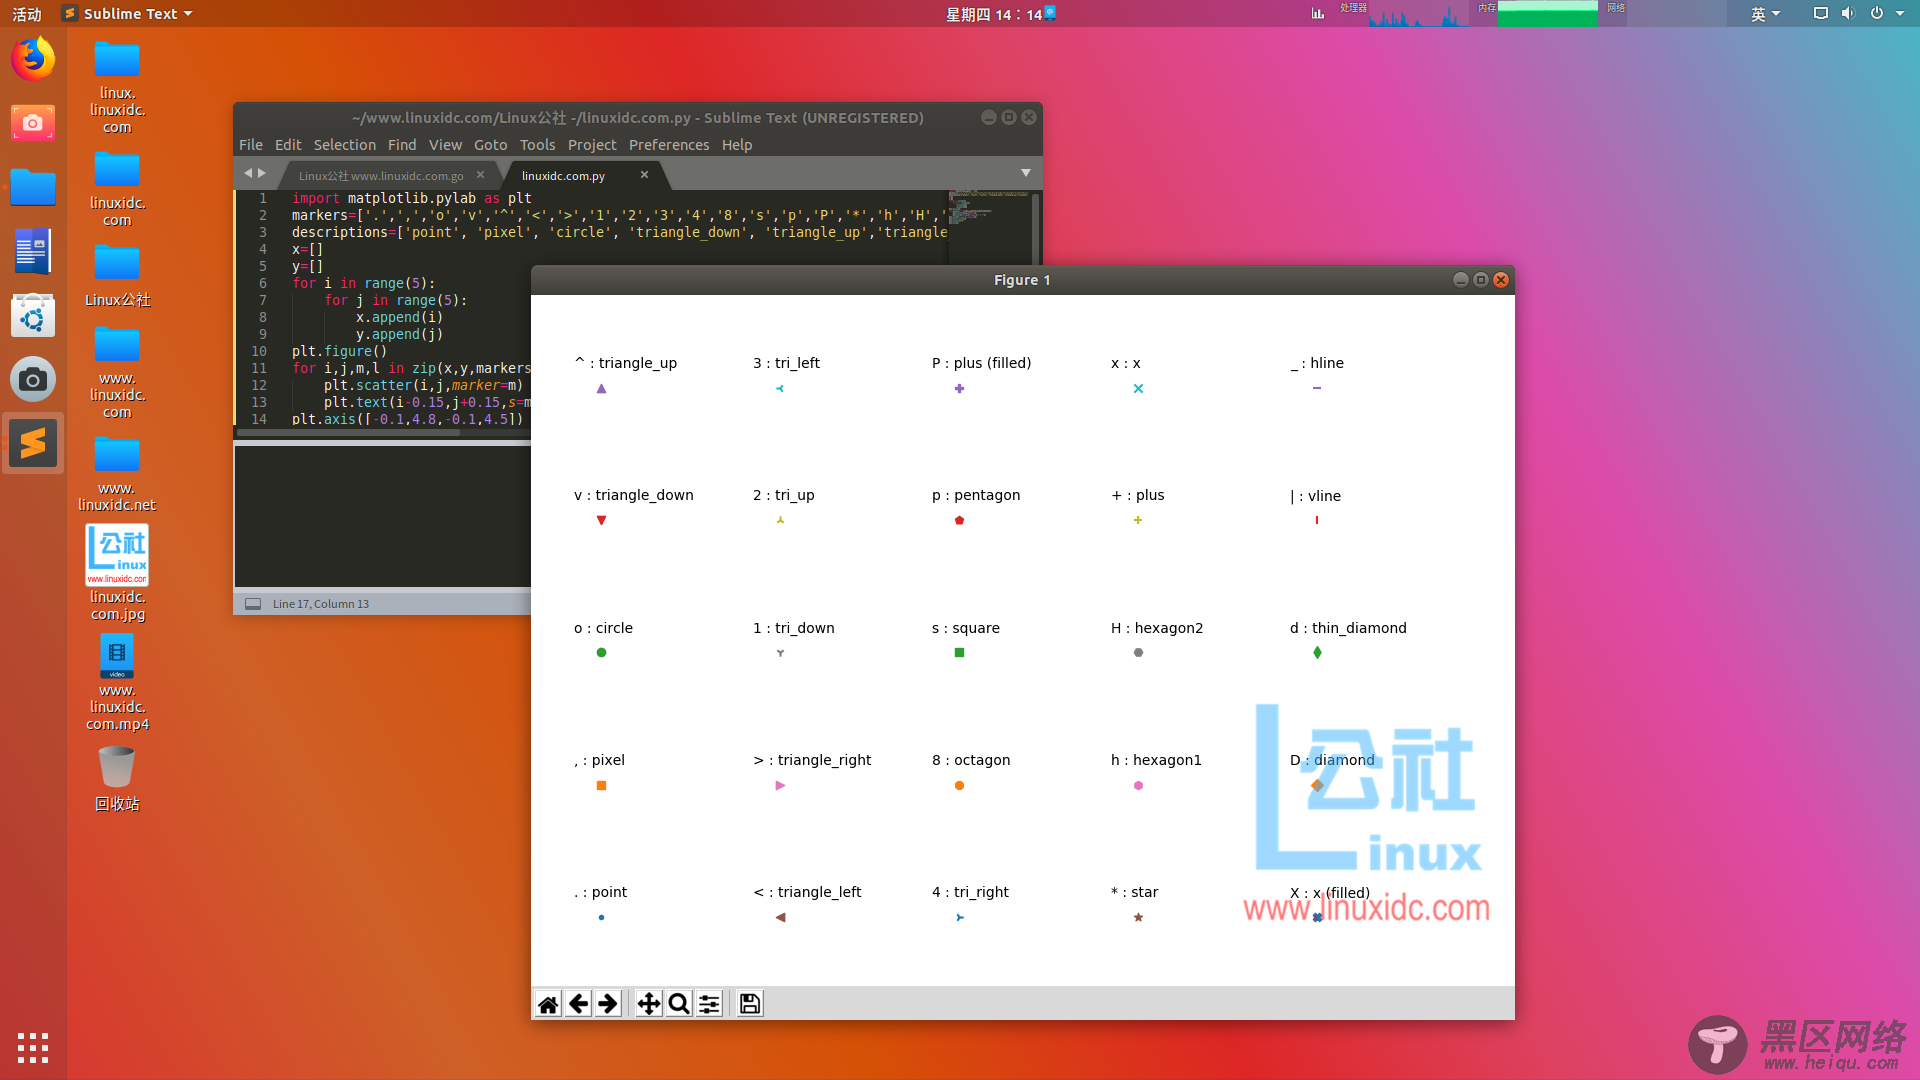
有一张图片显示所有标记的名称和描述,我希望它会对你有所帮助。

与matplotlib示例相比,我并没有做太多更改,下面是完整的代码。
import matplotlib.pyplot as plt
from matplotlib import colors as mcolors
colors = dict(mcolors.BASE_COLORS, **mcolors.CSS4_COLORS)
# Sort colors by hue, saturation, value and name.
by_hsv = sorted((tuple(mcolors.rgb_to_hsv(mcolors.to_rgba(color)[:3])), name)
for name, color in colors.items())
sorted_names = [name for hsv, name in by_hsv]
n = len(sorted_names)
ncols = 4
nrows = n // ncols
fig, ax = plt.subplots(figsize=(12, 10))
# Get height and width
X, Y = fig.get_dpi() * fig.get_size_inches()
h = Y / (nrows + 1)
w = X / ncols
for i, name in enumerate(sorted_names):
row = i % nrows
col = i // nrows
y = Y - (row * h) - h
xi_line = w * (col + 0.05)
xf_line = w * (col + 0.25)
xi_text = w * (col + 0.3)
ax.text(xi_text, y, name, fontsize=(h * 0.8),
horizontalalignment='left',
verticalalignment='center')
ax.hlines(y + h * 0.1, xi_line, xf_line,
color=colors[name], linewidth=(h * 0.8))
ax.set_xlim(0, X)
ax.set_ylim(0, Y)
ax.set_axis_off()
fig.subplots_adjust(left=0, right=1,
top=1, bottom=0,
hspace=0, wspace=0)
plt.show()

如果您想在使用matplotlib绘图时使用其他命名颜色,可以使用xkcd颜色名称,通过'xkcd:'前缀:
plt.plot([1,2], lw=4, c='xkcd:baby poop green')
现在您可以访问大量的命名颜色! https://www.linuxidc.com/tools/color/rgb/index.html
linestyle可选参数:
'-' solid line style
'--' dashed line style
'-.' dash-dot line style
':' dotted line style
marker可选参数:
'.' point marker
',' pixel marker
'o' circle marker
'v' triangle_down marker
'^' triangle_up marker
'<' triangle_left marker
'>' triangle_right marker
'1' tri_down marker
'2' tri_up marker
'3' tri_left marker
'4' tri_right marker
's' square marker
'p' pentagon marker
'*' star marker
'h' hexagon1 marker
'H' hexagon2 marker
'+' plus marker
'x' x marker
'D' diamond marker
'd' thin_diamond marker
'|' vline marker
'_' hline marker
matplotlib中color可用的颜色:
cnames = {
'aliceblue': '#F0F8FF',
'antiquewhite': '#FAEBD7',
'aqua': '#00FFFF',
'aquamarine': '#7FFFD4',
'azure': '#F0FFFF',
'beige': '#F5F5DC',
'bisque': '#FFE4C4',
'black': '#000000',
'blanchedalmond': '#FFEBCD',
'blue': '#0000FF',
'blueviolet': '#8A2BE2',
'brown': '#A52A2A',
'burlywood': '#DEB887',
'cadetblue': '#5F9EA0',
'chartreuse': '#7FFF00',
'chocolate': '#D2691E',
'coral': '#FF7F50',
'cornflowerblue': '#6495ED',
'cornsilk': '#FFF8DC',
'crimson': '#DC143C',
'cyan': '#00FFFF',
'darkblue': '#00008B',
'darkcyan': '#008B8B',
'darkgoldenrod': '#B8860B',
'darkgray': '#A9A9A9',
'darkgreen': '#006400',
'darkkhaki': '#BDB76B',
'darkmagenta': '#8B008B',
'darkolivegreen': '#556B2F',
'darkorange': '#FF8C00',
'darkorchid': '#9932CC',
'darkred': '#8B0000',
'darksalmon': '#E9967A',
'darkseagreen': '#8FBC8F',
'darkslateblue': '#483D8B',
'darkslategray': '#2F4F4F',
'darkturquoise': '#00CED1',
'darkviolet': '#9400D3',
'deeppink': '#FF1493',
'deepskyblue': '#00BFFF',
'dimgray': '#696969',
'dodgerblue': '#1E90FF',
'firebrick': '#B22222',
'floralwhite': '#FFFAF0',
'forestgreen': '#228B22',
'fuchsia': '#FF00FF',
'gainsboro': '#DCDCDC',
'ghostwhite': '#F8F8FF',
'gold': '#FFD700',
'goldenrod': '#DAA520',
'gray': '#808080',
'green': '#008000',
'greenyellow': '#ADFF2F',
'honeydew': '#F0FFF0',
'hotpink': '#FF69B4',
'indianred': '#CD5C5C',
'indigo': '#4B0082',
'ivory': '#FFFFF0',
'khaki': '#F0E68C',
'lavender': '#E6E6FA',
'lavenderblush': '#FFF0F5',
'lawngreen': '#7CFC00',
'lemonchiffon': '#FFFACD',
'lightblue': '#ADD8E6',
'lightcoral': '#F08080',
'lightcyan': '#E0FFFF',
'lightgoldenrodyellow': '#FAFAD2',
'lightgreen': '#90EE90',
'lightgray': '#D3D3D3',
'lightpink': '#FFB6C1',
'lightsalmon': '#FFA07A',
'lightseagreen': '#20B2AA',
'lightskyblue': '#87CEFA',
'lightslategray': '#778899',
'lightsteelblue': '#B0C4DE',
'lightyellow': '#FFFFE0',
'lime': '#00FF00',
'limegreen': '#32CD32',
'linen': '#FAF0E6',
'magenta': '#FF00FF',
'maroon': '#800000',
'mediumaquamarine': '#66CDAA',
'mediumblue': '#0000CD',
'mediumorchid': '#BA55D3',
'mediumpurple': '#9370DB',
'mediumseagreen': '#3CB371',
'mediumslateblue': '#7B68EE',
'mediumspringgreen': '#00FA9A',
'mediumturquoise': '#48D1CC',
'mediumvioletred': '#C71585',
'midnightblue': '#191970',
'mintcream': '#F5FFFA',
'mistyrose': '#FFE4E1',
'moccasin': '#FFE4B5',
'navajowhite': '#FFDEAD',
'navy': '#000080',
'oldlace': '#FDF5E6',
'olive': '#808000',
'olivedrab': '#6B8E23',
'orange': '#FFA500',
'orangered': '#FF4500',
'orchid': '#DA70D6',
'palegoldenrod': '#EEE8AA',
'palegreen': '#98FB98',
'paleturquoise': '#AFEEEE',
'palevioletred': '#DB7093',
'papayawhip': '#FFEFD5',
'peachpuff': '#FFDAB9',
'peru': '#CD853F',
'pink': '#FFC0CB',
'plum': '#DDA0DD',
'powderblue': '#B0E0E6',
'purple': '#800080',
'red': '#FF0000',
'rosybrown': '#BC8F8F',
'royalblue': '#4169E1',
'saddlebrown': '#8B4513',
'salmon': '#FA8072',
'sandybrown': '#FAA460',
'seagreen': '#2E8B57',
'seashell': '#FFF5EE',
'sienna': '#A0522D',
'silver': '#C0C0C0',
'skyblue': '#87CEEB',
'slateblue': '#6A5ACD',
'slategray': '#708090',
'snow': '#FFFAFA',
'springgreen': '#00FF7F',
'steelblue': '#4682B4',
'tan': '#D2B48C',
'teal': '#008080',
'thistle': '#D8BFD8',
'tomato': '#FF6347',
'turquoise': '#40E0D0',
'violet': '#EE82EE',
'wheat': '#F5DEB3',
'white': '#FFFFFF',
'whitesmoke': '#F5F5F5',
'yellow': '#FFFF00',
'yellowgreen': '#9ACD32'}
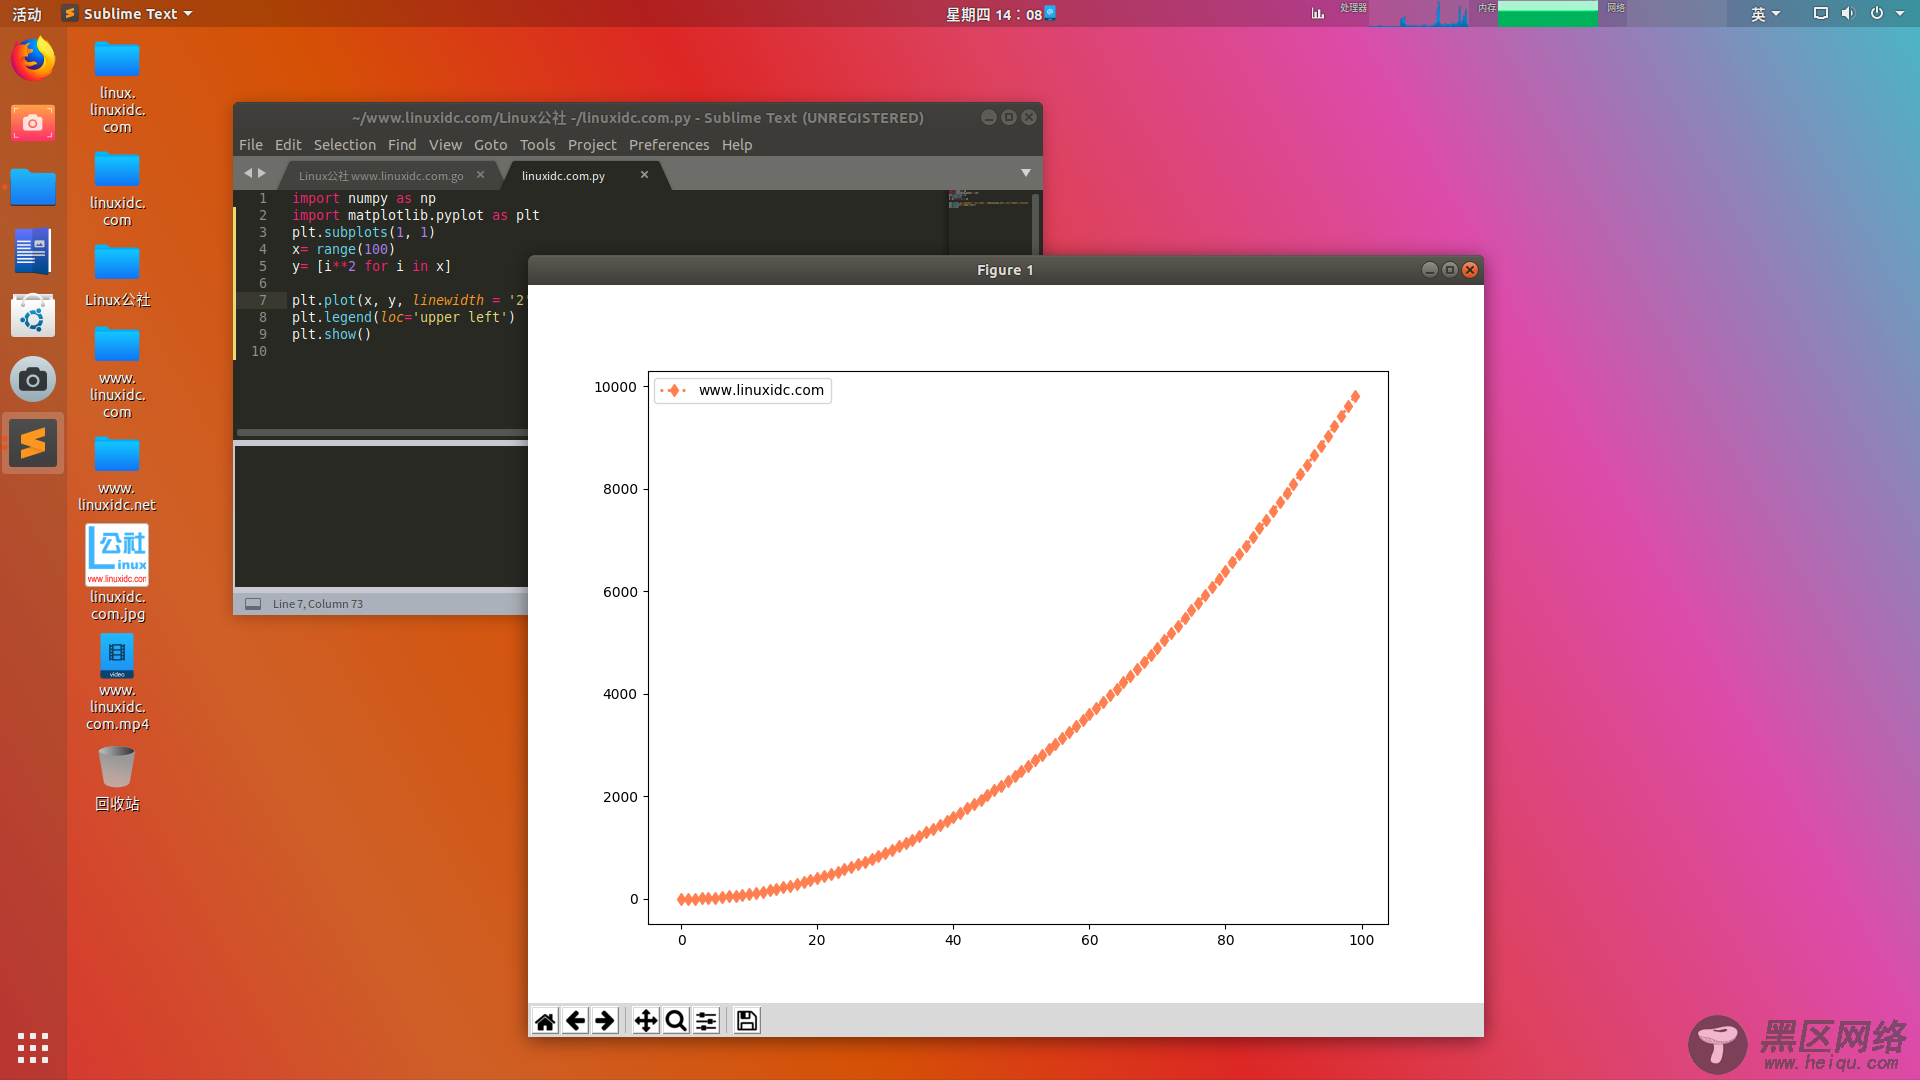
例子
import numpy as np
import matplotlib.pyplot as plt
plt.subplots(1, 1)
x= range(100)
y= [i**2 for i in x]
plt.plot(x, y, linewidth = '2', label = 'www.linuxidc.com', color='coral', linestyle=':', marker='d')
plt.legend(loc='upper left')
plt.show()

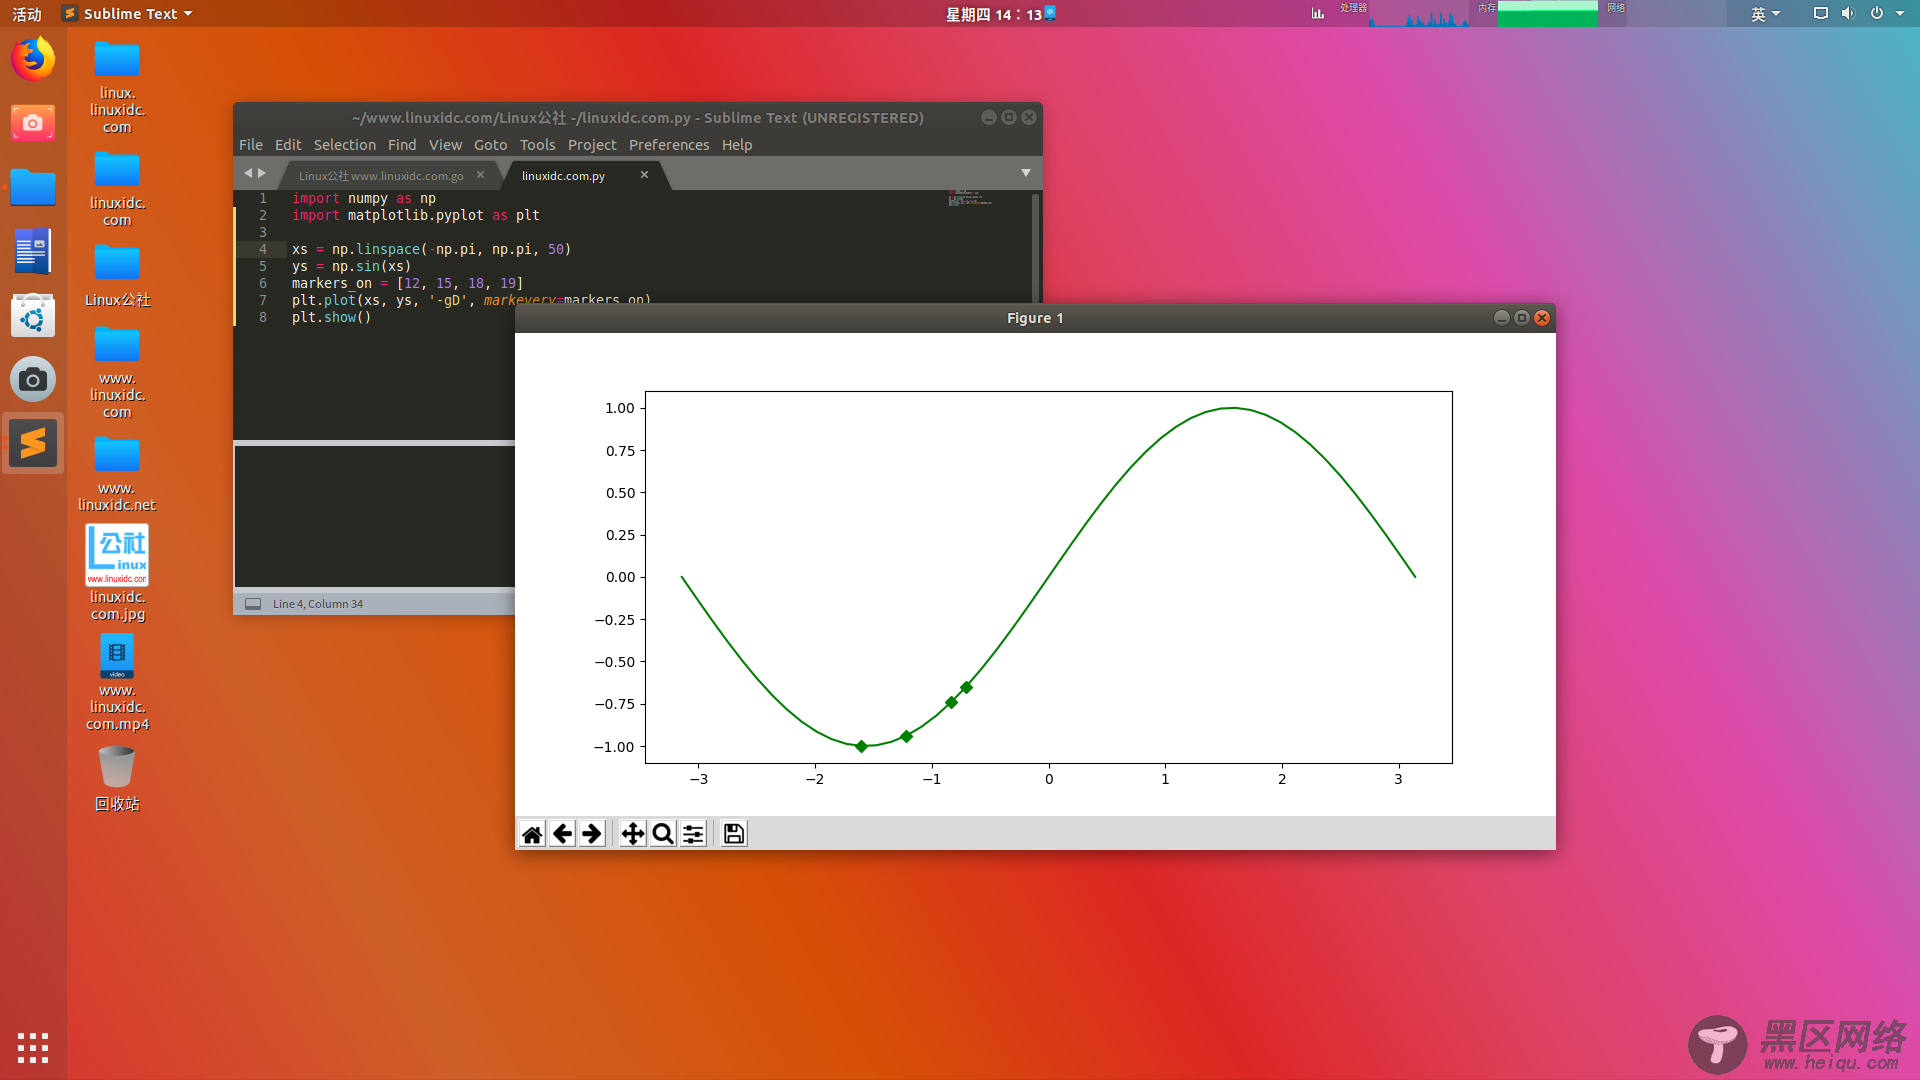
说明:其实上面color='coral'中,可以换成color='#be03fd',每两个十六进制数分别代表R、G、B分量:

import numpy as np
import matplotlib.pyplot as plt
xs = np.linspace(-np.pi, np.pi, 30)
ys = np.sin(xs)
markers_on = [12, 17, 18, 19]
plt.plot(xs, ys, '-gD', markevery=markers_on)
plt.show()

相关文档及代码可从以下信息得到下载:

