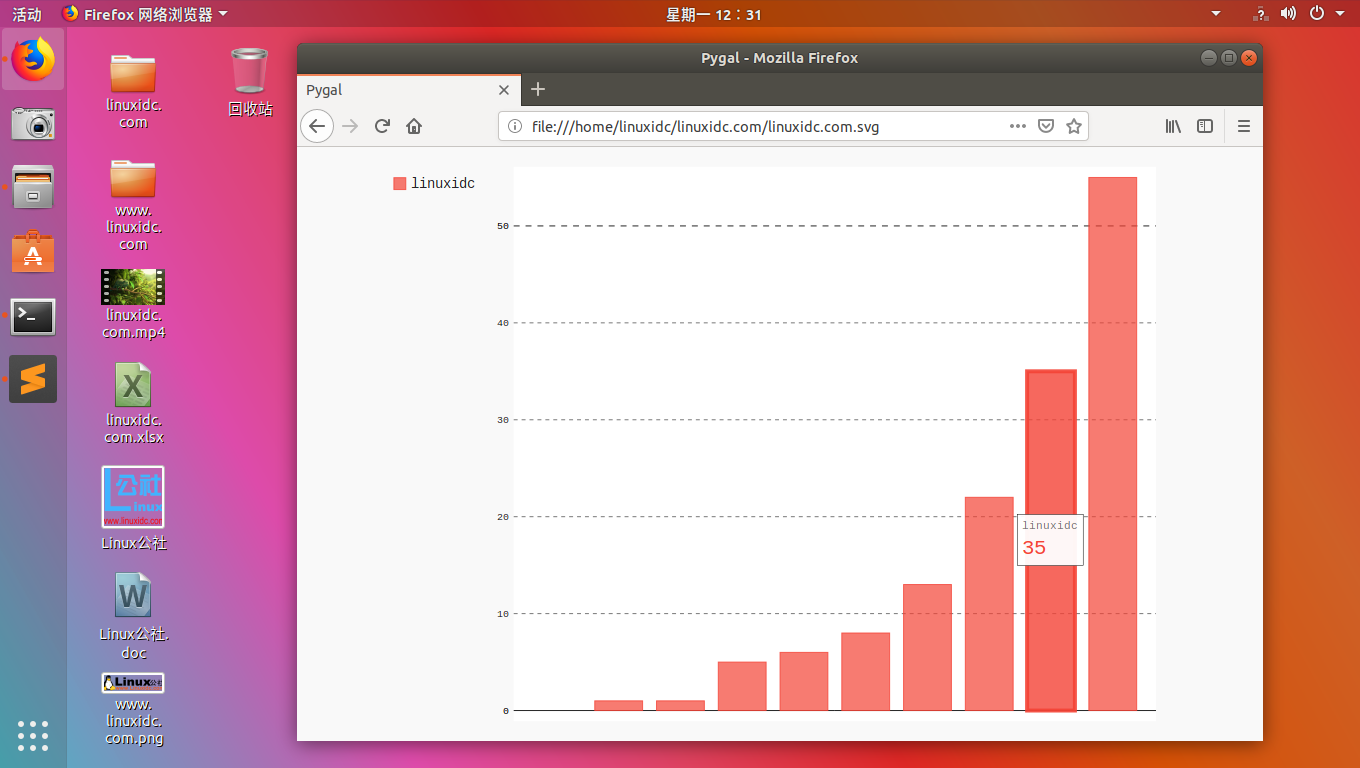
在当前目录生成的是黑色的 linuxidc.com.svg 文件,因为是 svg 格式的,一般的话直接是不能打开的,选择默认的浏览器打开吧,看到就是底下这个样子:

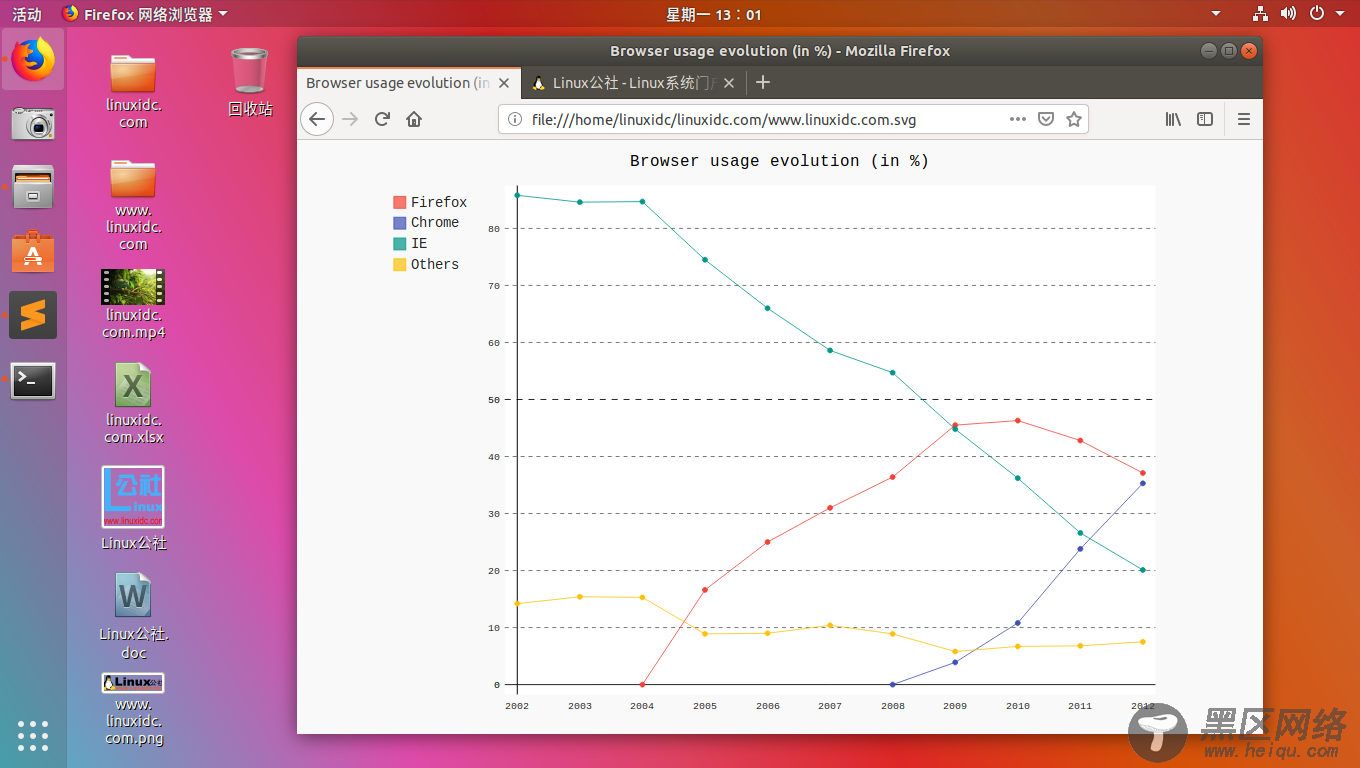
更加炫酷点的图:
import pygal
line_chart = pygal.Line()
line_chart.title = 'Browser usage evolution (in %)'
line_chart.x_labels = map(str, range(2002, 2013))
line_chart.add('Firefox', [None, None, 0, 16.6, 25, 31, 36.4, 45.5, 46.3, 42.8, 37.1])
line_chart.add('Chrome', [None, None, None, None, None, None, 0, 3.9, 10.8, 23.8, 35.3])
line_chart.add('IE', [85.8, 84.6, 84.7, 74.5, 66, 58.6, 54.7, 44.8, 36.2, 26.6, 20.1])
line_chart.add('Others', [14.2, 15.4, 15.3, 8.9, 9, 10.4, 8.9, 5.8, 6.7, 6.8, 7.5])
line_chart.render_to_file('www.linuxidc.com.svg')
生成的图就是下面这个样子:

有时候,我们不需要 svg,只需要 png 格式的图表,没关系,pygal 也能够做到:
import pygal
bar_chart = pygal.Bar()
bar_chart.add('linuxidc', [0, 1, 1, 5, 7, 8, 15, 21, 35, 60])
bar_chart.render_to_file('linux.linuxidc.com.svg')
# 生成 png 格式图表
bar_chart.render_to_png(filename='linux.linuxidc.com.png')
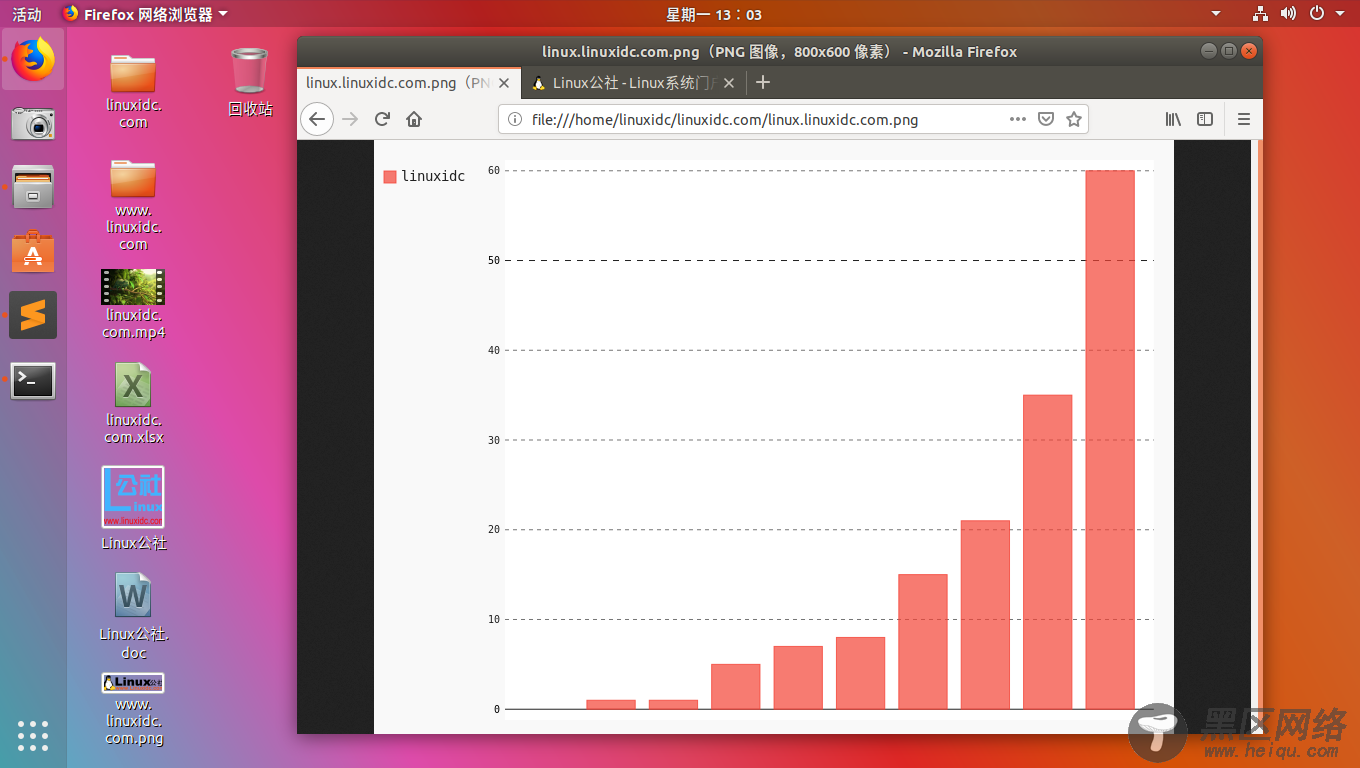
成功生成 png 格式的图片:

让 Pygal 生成的 svg 格式图片中,显示在你的网页上呗,我们选择 flask 来提供 web 支持:
linuxidc@linuxidc:~/linuxidc.com$ pip3 install flask -i https://pypi.douban.com/simple/
核心代码如下,没错就是这么短:
import pygal
from flask import Flask
app = Flask(__name__)
@app.route('/')
def drawSVG():
line_chart = pygal.Line(legend_at_bottom=True,legend_box_size=18)
line_chart.title = 'Browser usage evolution (in %)'
line_chart.x_labels = map(str, range(2002, 2013))
line_chart.add('Firefox', [None, None, 0, 16.6, 25, 31, 36.4, 45.5, 46.3, 42.8, 37.1])
line_chart.add('Chrome', [None, None, None, None, None, None, 0, 3.9, 10.8, 23.8, 35.3])
line_chart.add('IE', [85.8, 84.6, 84.7, 74.5, 66, 58.6, 54.7, 44.8, 36.2, 26.6, 20.1])
line_chart.add('Others', [14.2, 15.4, 15.3, 8.9, 9, 10.4, 8.9, 5.8, 6.7, 6.8, 7.5])
svg = line_chart.render_response()
return svg
if __name__ == '__main__':
app.run()
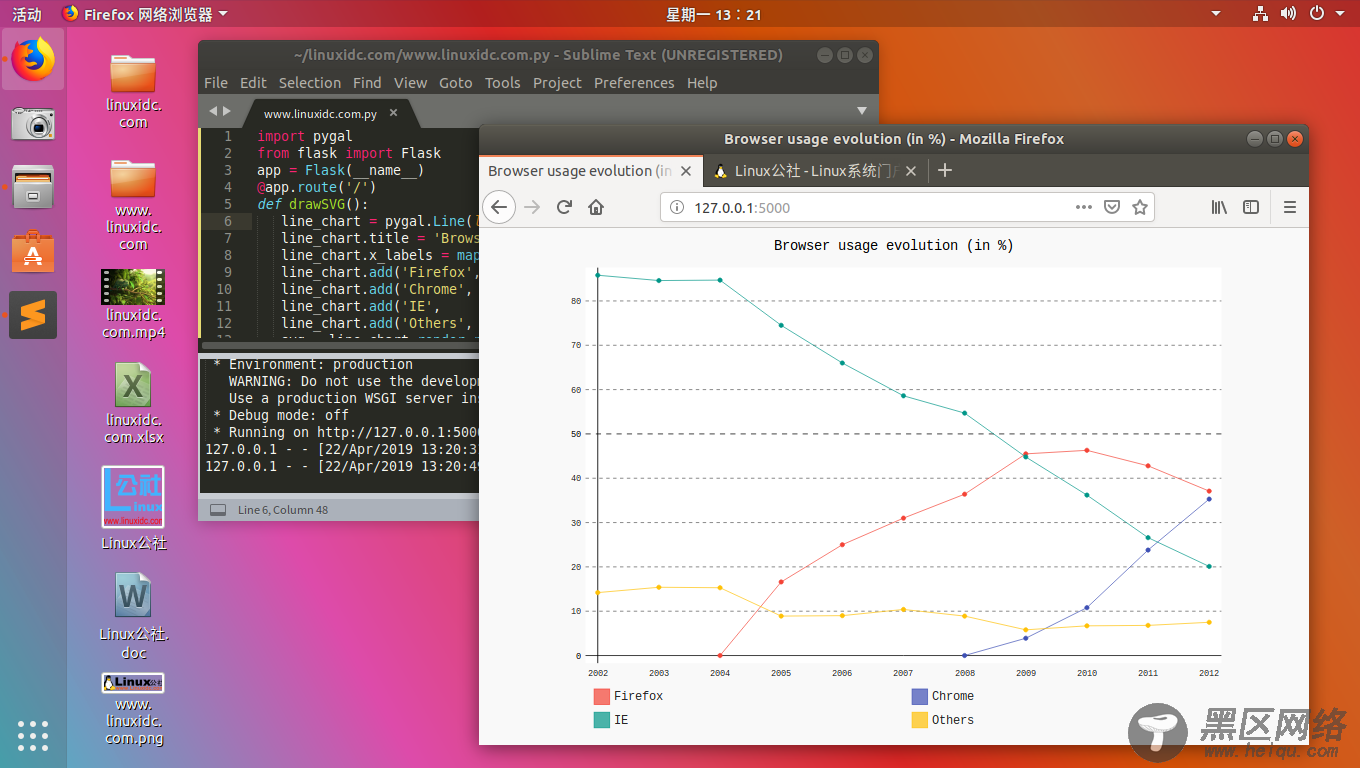
打开 127.0.0.1:5000 就能看到下面的样子咯:

总结
以上就是Ubuntu下使用Python的pygal库创建SVG矢量图形的全部内容了,希望本文的内容对大家的学习或者工作能带来一定的帮助,如果想学习更多内容还请移步 pygal 官方文档吧。

