opencv对于读进来的图片的通道排列是BGR,而不是主流的RGB!谨记!
#opencv读入的矩阵是BGR,如果想转为RGB,可以这么转
img4 = cv2.imread('1.jpg')
img4 = cv2.cvtColor(img4,cv2.COLOR_BGR2RGB)
访问像素
#访问像素
print(img4[10,10]) #3channels
print(gray[10,10]) #1channel
img4[10,10] = [255,255,255]
gray[10,10] = 255
print(img4[10,10]) #3channels
print(gray[10,10]) #1channel
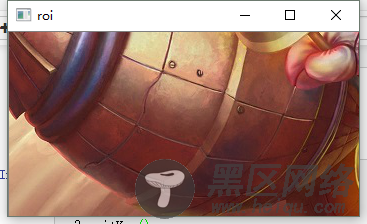
ROI操作
#roi操作
roi = img4[200:550,100:450,:]
cv2.imshow('roi',roi)
cv2.waitKey()
通道操作
#分离通道
img5 = cv2.imread('1.jpg')
b,g,r = cv2.split(img5)
#合并通道
img5 = cv2.merge((b,g,r))
#也可以不拆分
img5[:,:,2] = 0 #将红色通道值全部设0
PIL:PIL.Image.open
图片读取
from PIL import Image
import numpy as np
PIL即Python Imaging Library,也即为我们所称的Pillow,是一个很流行的图像库,它比opencv更为轻巧,正因如此,它深受大众的喜爱。
图像读写
PIL读进来的图像是一个对象,而不是我们所熟知的numpy 矩阵。
img = Image.open('1.jpg')
print(img.format)
print(img.size) #注意,省略了通道 (w,h)
print(img.mode) #L为灰度图,RGB为真彩色,RGBA为加了透明通道
img.show() # 显示图片

灰度图的获取
gray = Image.open('1.jpg').convert('L')
gray.show()

#读取不到图片会抛出异常IOError,我们可以捕捉它,做异常处理
try:
img2 = Image.open('2.jpg')
except IOError:
print('fail to load image!')
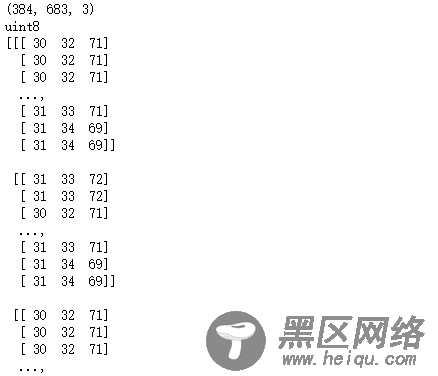
#pillow读进来的图片不是矩阵,我们将图片转矩阵,channel last
arr = np.array(img3)
print(arr.shape)
print(arr.dtype)
print(arr)
灰度图的转化与彩图转化一样
arr_gray = np.array(gray)
print(arr_gray.shape)
print(arr_gray.dtype)
print(arr_gray)

存储图片
#矩阵再转为图像
new_im = Image.fromarray(arr)
new_im.save('3.png')
图像操作
#分离合并通道
r, g, b = img.split()
img = Image.merge("RGB", (b, g, r))
img = img.copy() #复制图像
ROI获取
img3 = Image.open('1.jpg')
roi = img3.crop((0,0,300,300)) #(左上x,左上y,右下x,右下y)坐标
roi.show()
matplotlib:matplotlib.image.imread
matplotlib是一个科学绘图神器,用的人非常多。
import matplotlib.pyplot as plt
import numpy as np
image = plt.imread('1.jpg')
plt.imshow(image)
plt.show()
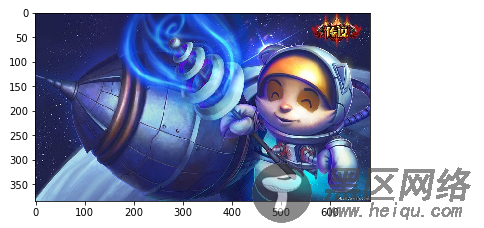
#也可以关闭显示x,y轴上的数字
image = plt.imread('1.jpg')
plt.imshow(image)
plt.axis('off')
plt.show()

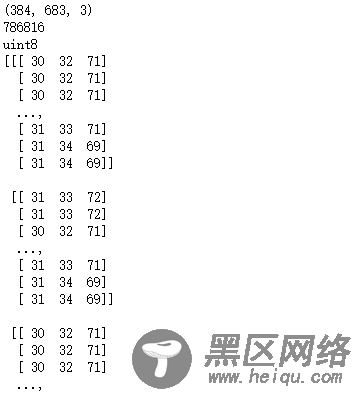
#plt.imread读入的就是一个矩阵,跟opencv一样,但彩图读进的是RGB,与opencv有区别
print(image.shape) # (h,w,c)
print(image.size)
print(image.dtype)
print(image)
im_r = image[:,:,0] #红色通道
plt.imshow(im_r)
plt.show()
#此时会发现显示的是热量图,不是我们预想的灰度图,可以添加 cmap 参数解决
plt.imshow(im_r,cmap='Greys_r')
plt.show()

#与opencv结合使用
import cv2
im2 = cv2.imread('1.jpg')
plt.imshow(im2)
plt.axis('off')
plt.show()
#发现图像颜色怪怪的,原因当然是我们前面提到的RGB顺序不同的原因啦,转一下就好
im2 = cv2.cvtColor(im2,cv2.COLOR_BGR2RGB)
plt.imshow(im2)
plt.axis('off')
plt.show()
#所以无论用什么库读进图片,只要把图片改为矩阵,那么matplotlib就可以处理了

#再试一试pillow和matplotlib结合
from PIL import Image
im3 = Image.open('1.jpg')
im3 = np.array(im3)
plt.figure(1)
plt.imshow(im3)
plt.axis('off')
#存储图像,注意,必须在show之前savefig,否则存储的图片一片空白
plt.savefig('timo.jpg')
plt.show()
