
var i=1; function progress(){ setInterval("beginProgress()", 600); } function beginProgress(){ $("#img").attr("src", "img.php?m="+i); i++; if(i>=12){ i=1; } }
index.php:
<!DOCTYPE html PUBLIC "-//W3C//DTD XHTML 1.0 Transitional//EN" "http://www.w3.org/TR/xhtml1/DTD/xhtml1-transitional.dtd"> <html xmlns="http://www.w3.org/1999/xhtml"> <head> <meta http-equiv="Content-Type" content="text/html; charset=gb2312" /> <title>Ajax+Jpgraph制作动态折线图</title> </head> <script language="javascript" src="https://www.jb51.net/js/jquery-1.3.2.js"></script> <script language="javascript" src="https://www.jb51.net/js/fun.js"></script> <body> <img src="img.php?m=0" /> <br> <input type="button" value="开始"/> </body> </html>
img.php:
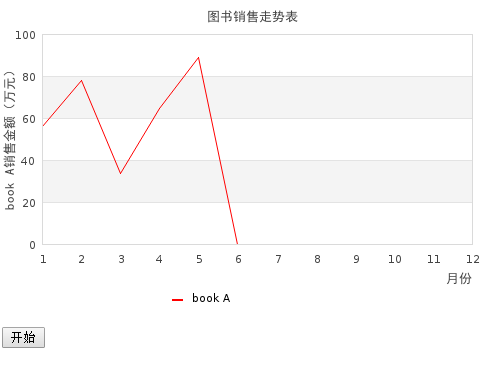
<?php require_once 'src/jpgraph.php'; //导入Jpgraph类库 require_once 'src/jpgraph_line.php'; //导入Jpgraph类库的柱状图功能 $dataTmp = array(56, 78, 34, 65, 89, 24 ,67 ,88, 45, 68, 70, 50); //设置统计数据 $data1 = array(0, 0, 0, 0, 0, 0 ,0 ,0, 0, 0, 0, 0); //设置统计数据 $m = $_GET['m']; for($i=0; $i<$m; $i++){ $data1[$i] = $dataTmp[$i]; } $graph = new Graph(500, 320); $graph->SetScale("textlin"); $graph->SetShadow(); $graph->img->SetMargin(40, 30, 30, 70); $graph->title->Set("图书销售走势表"); $lineplot1 = new LinePlot($data1); $graph->Add($lineplot1); $graph->xaxis->title->Set("月份"); $graph->yaxis->title->Set("book A销售金额(万元)"); $graph->title->SetFont(FF_SIMSUN, FS_BOLD); $graph->yaxis->title->SetFont(FF_SIMSUN, FS_BOLD); $graph->xaxis->title->SetFont(FF_SIMSUN, FS_BOLD); $lineplot1->SetColor('red'); $lineplot1->SetLegend('book A'); $graph->legend->SetLayout(LEGEND_HOR); $graph->legend->Pos(0.4, 0.95, 'center', 'bottom'); $graph->Stroke();
二 运行结果
更多关于PHP相关内容感兴趣的读者可查看本站专题:《PHP+ajax技巧与应用小结》、《PHP网络编程技巧总结》、《PHP基本语法入门教程》、《php面向对象程序设计入门教程》、《php字符串(string)用法总结》、《php+mysql数据库操作入门教程》及《php常见数据库操作技巧汇总》