1.vue中echarts的使用
引入echarts后
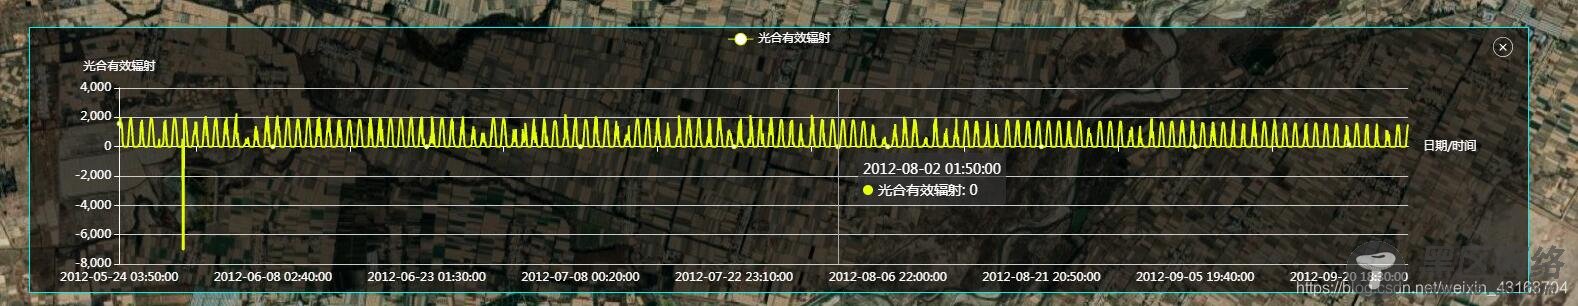
let myChart = echarts.init(document.getElementById('dsm'));//dsm为绑定的dom结构 var option = { //backgroundColor:"#111c4e", tooltip: { trigger: 'axis' }, legend: { //图表上方的图例显隐 data:['光合有效辐射'], textStyle: { color: '#fff' } }, color:['#E4FD0A'], grid: { //图表里上下左右的空间 间隙 left: '3%', right: '8%', bottom: '3%', containLabel: true }, xAxis: { //x轴属性 type: 'category', name: '日期/时间', // boundaryGap: false, data: this.xZhou, axisLine:{ lineStyle:{color:'#fff'} // x轴坐标轴颜色 }, axisLabel: { show: true, color: '#fff', fontSize:12, // rotate: 30 } }, yAxis: { //y轴属性 type: 'value', name: '光合有效辐射', axisLine:{ lineStyle:{color:'#fff'} // x轴坐标轴颜色 }, axisLabel: { show: true, color: '#fff', fontSize:12, // rotate: 30 } }, series: [ //为鼠标在图表中划过时显示的数据 { name:'光合有效辐射', type:'line', stack: '总量', data:this.yZhou, lineStyle:{ normal:{ color: '#E4FD0A' } } } ] }; myChart.setOption(option) window.addEventListener("resize", function () { //设置图表因窗口大小的变化进行变化 myChart.resize(); });
上述图表的显示效果为:
2.echarts与elementui-select的协同绑定
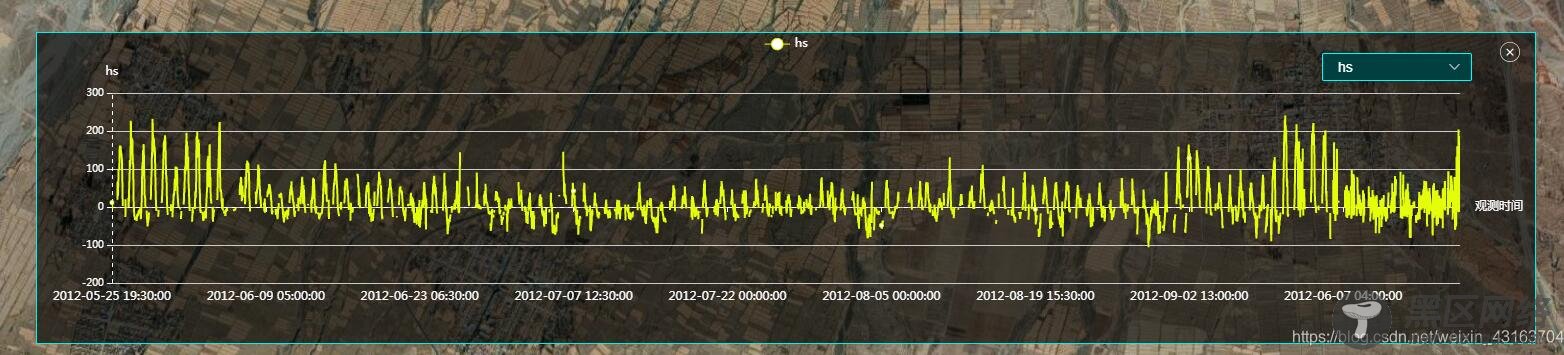
实现依据elementui-select的变化而变化图表。
<template> <div> <div v-show="isXM"> <div @click="close"></div> <div> <el-select v-model="defaultyAxis" //利用v-model对默认数据defaultyAxis进行改变,实际绑定的数据是yAxisOption placeholder="请选择" popper-class="trsfChartSelect-popper" @change="renderChart()" > <el-option v-for="item in yAxisOption" :key="item" :label="item" :value="item"></el-option> </el-select> <div></div> </div> </div> </div> </template>
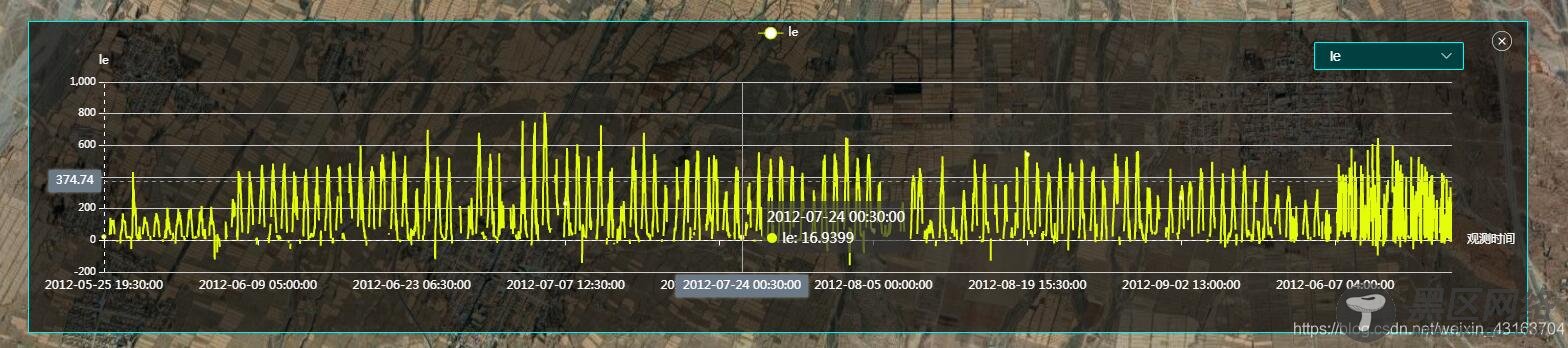
<script> import { zsfEntity} from '@/api/sfcl.js' export default { name: 'Home', data() { return { isXM: true, yAxisOption: ['a', 'b'], defaultyAxis: '', dataOgj: {}, } }, mounted() { this.$comjs.addSimplePoint([100.62713539843939, 38.620863795306164]) //cesium挂载图标 this.getChartDataAndRender() }, methods: { close() { this.isXM = false this.$store.commit('getComponent1', '') }, getChartDataAndRender(){ //axios获取异步数据 var _this = this zsfEntity().then(res => { if(res.obj.length == 0){ return } let keyArr = Object.keys(res.obj[0]) for (let item of keyArr) { _this.dataOgj[item] = [] } for (let item of res.obj) { for (let item1 of keyArr) { _this.dataOgj[item1].push(item[item1]) } } _this.yAxisOption = keyArr.slice(1)//y轴实际数据 四项 _this.defaultyAxis = _this.yAxisOption[0] //获取y轴默认数据 _this.renderChart() }) }, //渲染图表 renderChart() { let myChart = echarts.init(document.getElementById('zsfChart')) let option = { tooltip: { trigger: 'axis', axisPointer: { type: 'cross', label: { backgroundColor: '#6a7985' } } }, legend: { data:[this.defaultyAxis], textStyle: { color: '#fff' } }, grid: { right: '5%', left: '5%' }, color: ['#E4FD0A'], xAxis: { name: "观测时间", type: 'category', boundaryGap: false, data: this.dataOgj.observeTime, axisLabel: { color: '#ffffff' // fontSize: 10, // rotate:30 }, axisLine: { lineStyle: { color: '#ffffff', type: 'dashed' } } }, yAxis: { name: this.defaultyAxis,//挂载默认数据 type: 'value', axisLabel: { color: '#ffffff', fontSize: 10 // rotate:30 }, axisLine: { lineStyle: { color: '#ffffff', type: 'dashed' } } }, series: [ { data: this.dataOgj[this.defaultyAxis], type: 'line', name: this.defaultyAxis } ] } myChart.setOption(option) window.addEventListener('resize', function() { myChart.resize() }) } }, destroyed(){ this.$comjs.removeSimplePoint() } } </script>
<style lang="stylus"> .trsfChartSelect-popper background: rgba(1,64,64,1) .el-select-dropdown__item.hover, .el-select-dropdown__item:hover background: rgba(0,0,0,0.5) .el-select-dropdown__item color: #fff </style> <style lang="stylus" scoped> @import '../../assets/styles/varibles.styl' .content position: absolute right: vw(10) top:vh(71) z-index: 100 color: #fff background: $bgColor .contentDetail width:vw(1500) height:vh(348) position: fixed right: 70px bottom: 27px margin:auto z-index: 100 color: #fff background: $bgColor border: 1px solid rgba(3,240,240,1) .close position:absolute right:vw(15) top:vh(10) cursor: pointer background-image:url("/images/lanhu/close.png") width: 20px; height: 20px; z-index: 1 .baseInfo height: 75px; padding-top: 30px; .baseInfo-item width: 33%; display: inline-block; text-align: left; margin-bottom: 20px; padding-left: 80px; .baseInfo-item-icon vertical-align: middle margin-right: 14px .baseInfo-item-text vertical-align: middle .separator height: 1px background: #03F0F0 .chartContent height: 100% .chartSelect position:absolute right: 63px margin-top: 20px width: 150px z-index: 1 /deep/ .el-input__inner height: 28px; line-height: 28px; background:rgba(1,64,64,1); border-radius:2px; border:1px solid rgba(0,252,252,1); color: #fff /deep/ .el-input__icon line-height: 28px; #zsfChart height: 100% width:100% </style>
效果实现
补充知识:vue项目在同一页面中引入多个echarts图表 ,并实现封装,自适应和动态数据改变
vue-Echarts