迭代公式的指数,使用的1+5j,这是个复数,所以是广义mandelbrot集,大家可以自行修改指数,得到其他图形。各种库安装不全的,自行想办法
Python 3.6.7。
Linux系统:Ubuntu 18.04.2
完整代码:
#encoding=utf-8 import numpy as np import pylab as pl import time from matplotlib import cm from math import log escape_radius = 10 iter_num = 20 def draw_mandelbrot2(cx, cy, d, N=600): global mandelbrot """ 绘制点(cx, cy)附近正负d的范围的Mandelbrot """ x0, x1, y0, y1 = cx-d, cx+d, cy-d, cy+d y, x = np.ogrid[y0:y1:N*1j, x0:x1:N*1j] c = x + y*1j smooth_mand = np.frompyfunc(smooth_iter_point,1,1)(c).astype(np.float) pl.gca().set_axis_off() pl.imshow(smooth_mand, cmap=cm.Blues_r, extent=[x0,x1,y1,y0]) pl.show() def smooth_iter_point(c): z = c #赋初值 d = 1+2j #这里,把幂运算的指数,设定成复数1+2j, 就是广义mandelbrot集合, d=2就是标准mandelbrot集,d=3就是三阶的 for i in range(1, iter_num): if abs(z)>escape_radius: break z = z**d+c # **运算符是幂运算 #下面是重新计算迭代次数,可以获取连续的迭代次数(即正规化) absz = abs(z) #复数的模 if absz > 2.0: mu = i - log(log(abs(z),2),2) else: mu = i return mu # 返回正规化的迭代次数 def draw_mandelbrot(cx, cy, d, N=800): """ 绘制点(cx, cy)附近正负d的范围的Mandelbrot """ global mandelbrot x0, x1, y0, y1 = cx-d, cx+d, cy-d, cy+d y, x = np.ogrid[y0:y1:N*1j, x0:x1:N*1j] c = x + y*1j # 创建X,Y轴的坐标数组 ix, iy = np.mgrid[0:N,0:N] # 创建保存mandelbrot图的二维数组,缺省值为最大迭代次数 mandelbrot = np.ones(c.shape, dtype=np.int)*100 # 将数组都变成一维的 ix.shape = -1 iy.shape = -1 c.shape = -1 z = c.copy() # 从c开始迭代,因此开始的迭代次数为1 start = time.clock() for i in xrange(1,100): # 进行一次迭代 z *= z z += c # 找到所有结果逃逸了的点 tmp = np.abs(z) > 2.0 # 将这些逃逸点的迭代次数赋值给mandelbrot图 mandelbrot[ix[tmp], iy[tmp]] = i # 找到所有没有逃逸的点 np.logical_not(tmp, tmp) # 更新ix, iy, c, z只包含没有逃逸的点 ix,iy,c,z = ix[tmp], iy[tmp], c[tmp],z[tmp] if len(z) == 0: break print ("time="),time.clock() - start pl.imshow(mandelbrot, cmap=cm.Blues_r, extent=[x0,x1,y1,y0]) pl.gca().set_axis_off() pl.show() #鼠标点击触发执行的函数 def on_press(event): global g_size print (event) print (dir(event)) newx = event.xdata newy = event.ydata print (newx) print (newy) #不合理的鼠标点击,直接返回,不绘制 if newx == None or newy == None or event.dblclick == True: return None #不合理的鼠标点击,直接返回,不绘制 if event.button == 1: #button ==1 代表鼠标左键按下, 是放大图像 g_size /= 2 elif event.button == 3: #button == 3 代表鼠标右键按下, 是缩小图像 g_size *= 2 else: return None print (g_size) draw_mandelbrot2(newx,newy,g_size) fig, ax = pl.subplots(1) g_size = 2.5 #注册鼠标事件 fig.canvas.mpl_connect('button_press_event', on_press) #初始绘制一个图 draw_mandelbrot2(0,0,g_size)
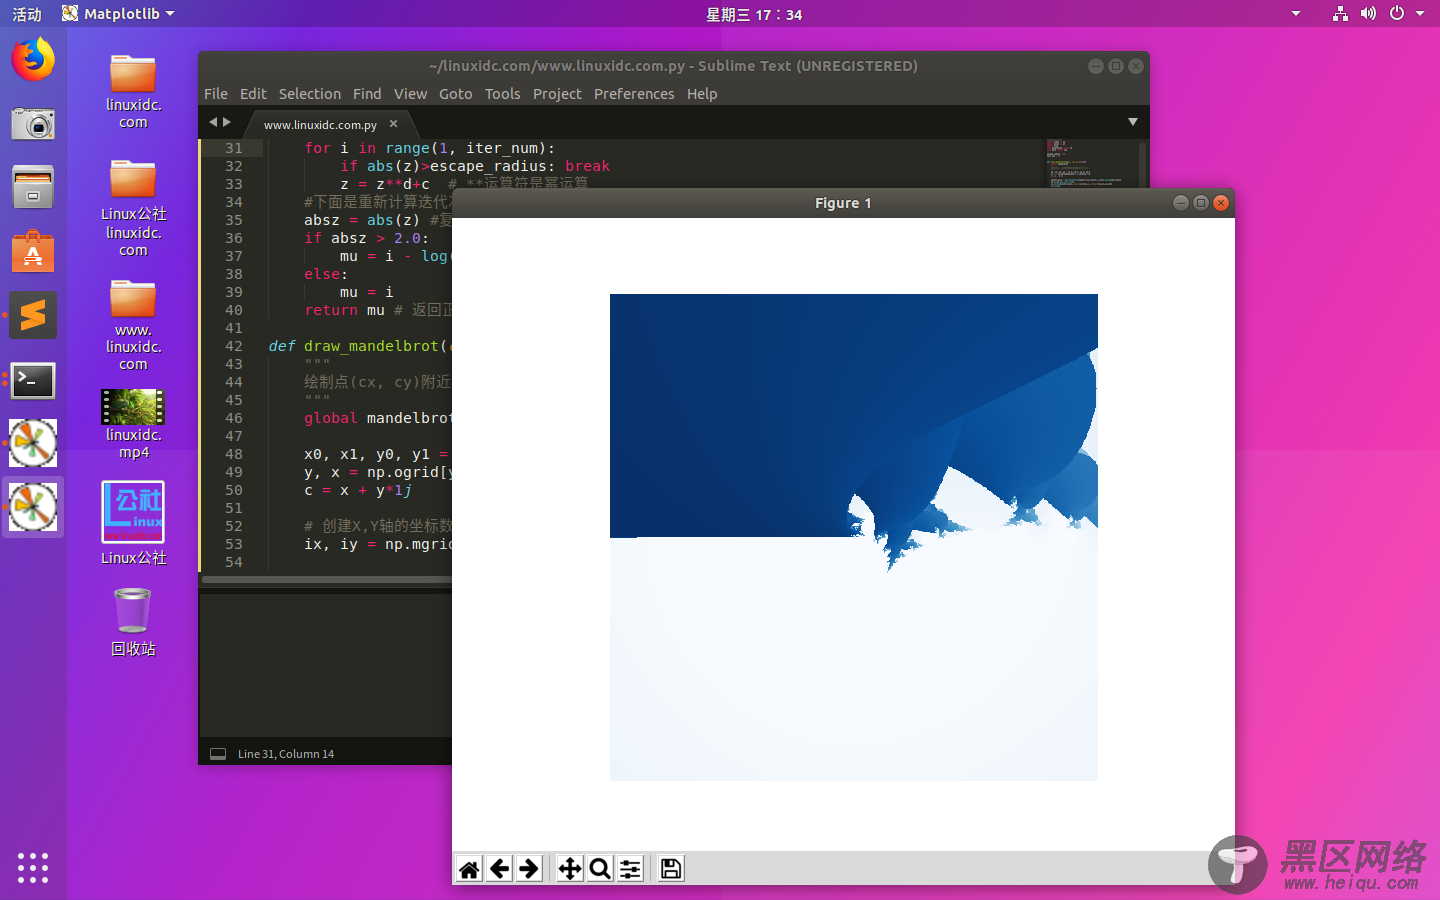
效果图如下: