使用Python的matplotlib绘制lozi混沌映射吸引子代码。
Python 3.6.7和matplotlib、numpy等库,安装不全的,请自行安装一下。
Linux系统:Ubuntu 18.04.2
代码:
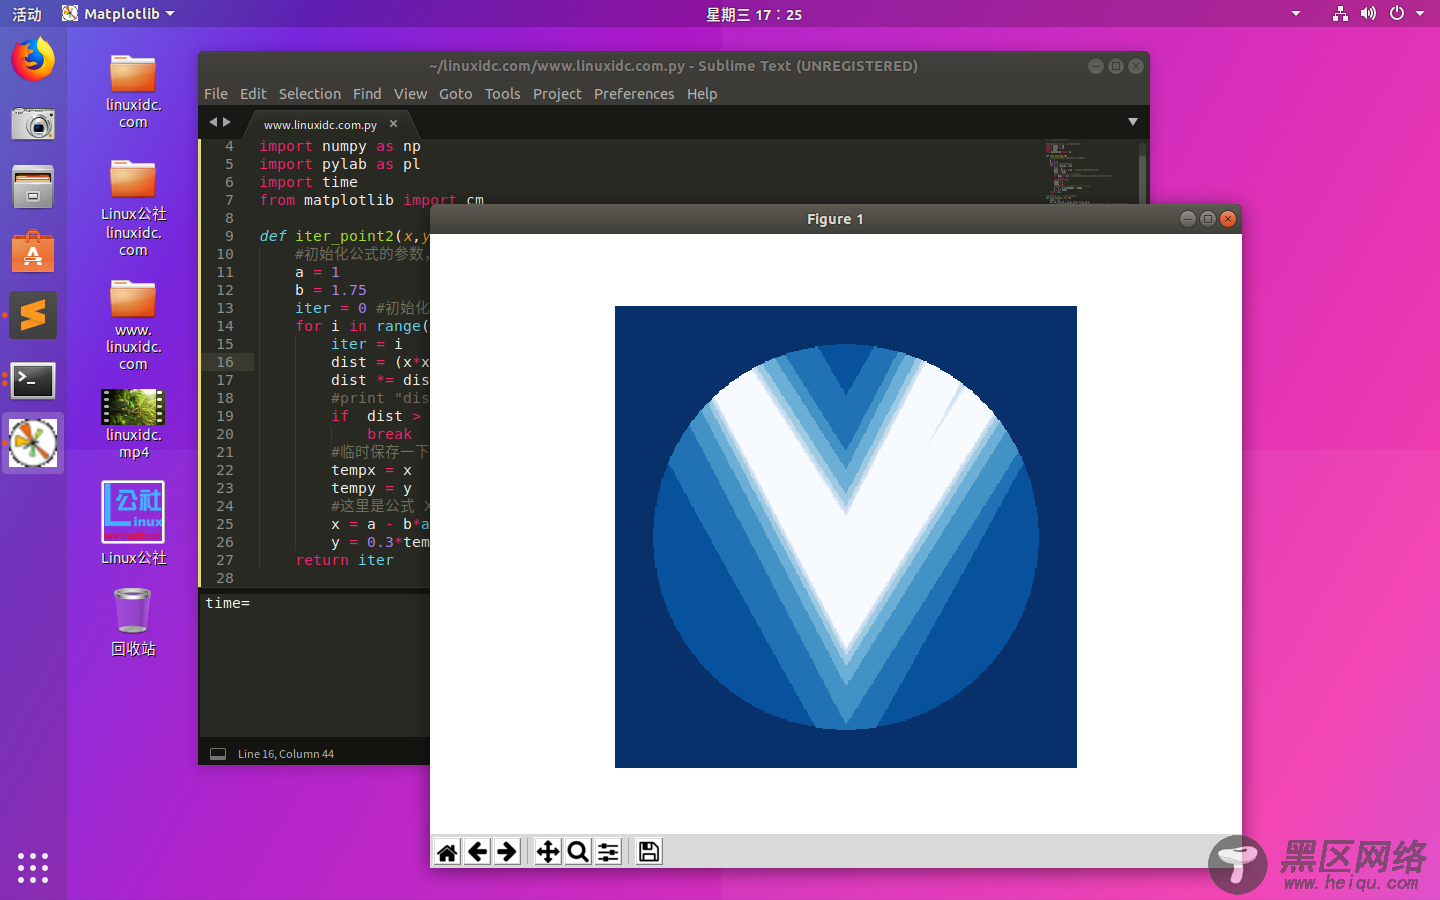
# -*- coding: utf-8 -*- #需要安装matplotlib、numpy等库才能运行 import numpy as np import pylab as pl import time from matplotlib import cm def iter_point2(x,y): #初始化公式的参数,需要改的话,可以改参数 a = 1 b = 1.75 iter = 0 #初始化迭代次数 for i in range(1, 10): iter = i dist = (x*x + y*y) #计算摸长,看是否超过最大限度 dist *= dist #print "dist:" + str(dist) if dist > 200: #如果超出了最大长度,就跳出循环,返回这个迭代次数 break #临时保存一下x和y tempx = x tempy = y #这里是公式 X = a-b|x| + y ; Y = 0.3x; x = a - b*abs(tempx) + tempy y = 0.3*tempx return iter #绘制图形时,以cx,xy为中心,距离为d def draw_lozi(cx, cy, d): size = 400 x0, x1, y0, y1 = cx-d, cx+d, cy-d, cy+d y, x = np.ogrid[y1:y0:size*1j, x0:x1:size*1j] #使用范围生成数组,后面用这个进行迭代 c = x + y*1j x.shape = -1 #转化成线性数组 y.shape = -1 start = time.clock() lozi = np.ones(c.shape) #遍历每一个点,计算迭代次数,赋值给数组lozi for j in range(0,size): for i in range(0,size): lozi[j][i] = iter_point2(x[i],y[j]) pass print ("time="),time.clock() - start #使用数组lozi,绘图, 使用蓝色调色板,显示到图上的坐标范围是x0,x1,y0,y1 pl.imshow(lozi, cmap=cm.Blues_r, extent=[x0,x1,y0,y1]) #不显示横纵坐标 pl.gca().set_axis_off() #刷新画布 pl.show() #鼠标点击触发执行的函数 def on_press(event): global g_size print (event) print (dir(event)) newx = event.xdata newy = event.ydata print (newx) print (newy) #不合理的鼠标点击,直接返回,不绘制 if newx == None or newy == None or event.dblclick == True: return None #不合理的鼠标点击,直接返回,不绘制 if event.button == 1: #button ==1 代表鼠标左键按下, 是放大图像 g_size /= 2 elif event.button == 3: #button == 3 代表鼠标右键按下, 是缩小图像 g_size *= 2 else: return None print (g_size) draw_lozi(newx,newy,g_size) fig, ax = pl.subplots(1) g_size = 4.5 #注册鼠标事件 fig.canvas.mpl_connect('button_press_event', on_press) #初始绘制一个图 draw_lozi(0,0,g_size)
运行如下图:

Henon映射的混沌吸引子
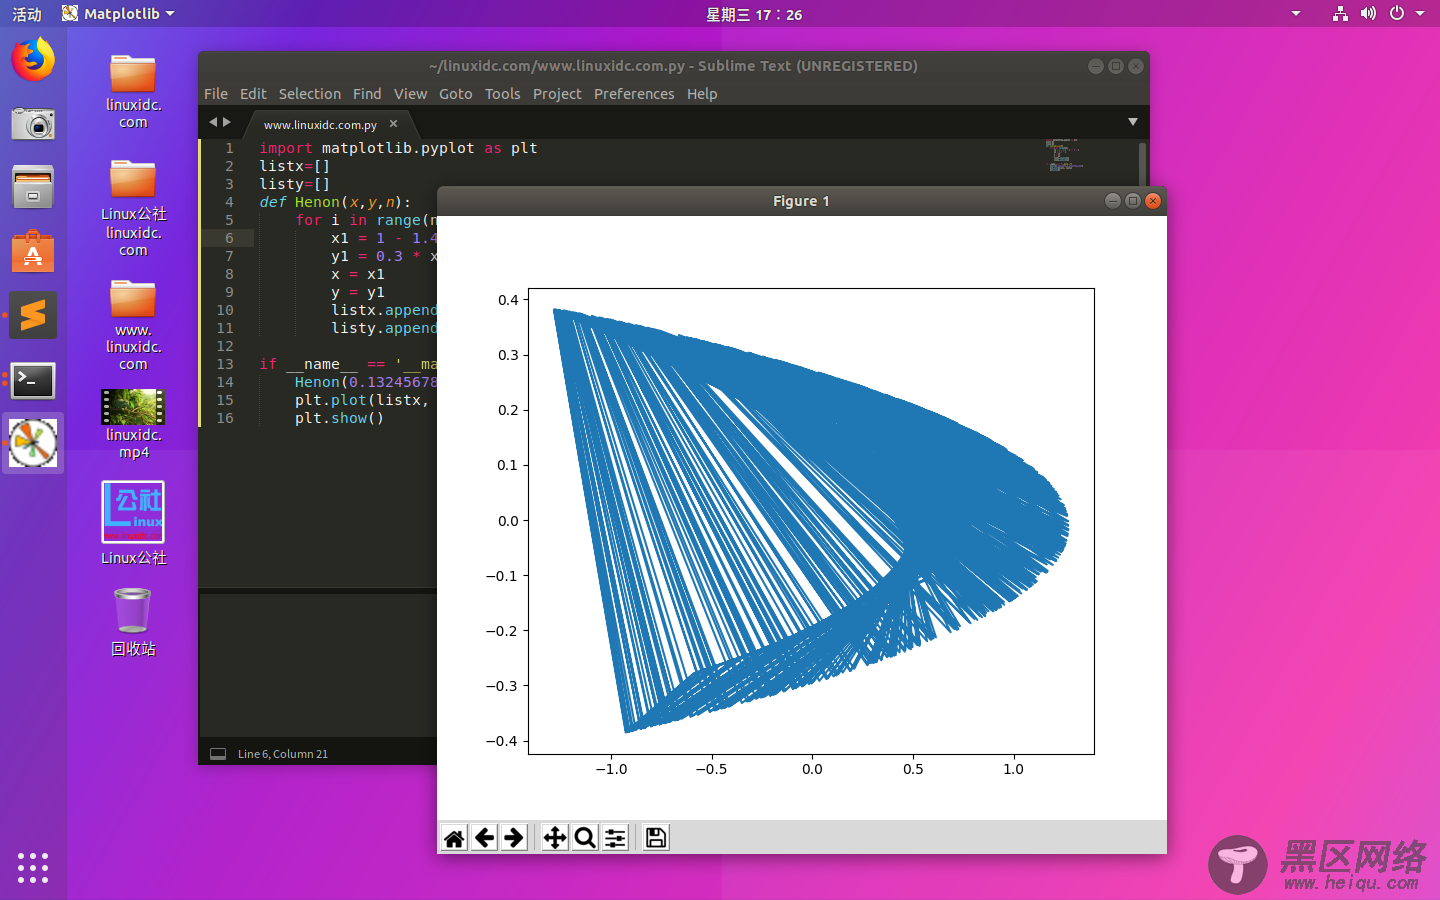
import matplotlib.pyplot as plt listx=[] listy=[] def Henon(x,y,n): for i in range(n): x1 = 1 - 1.4 * x ** 2 + y y1 = 0.3 * x x = x1 y = y1 listx.append(x) listy.append(y) if __name__ == '__main__': Henon(0.13245678,0.13246789,1000) plt.plot(listx, listy) plt.show()
运行效果如下:

Lorenz吸引子
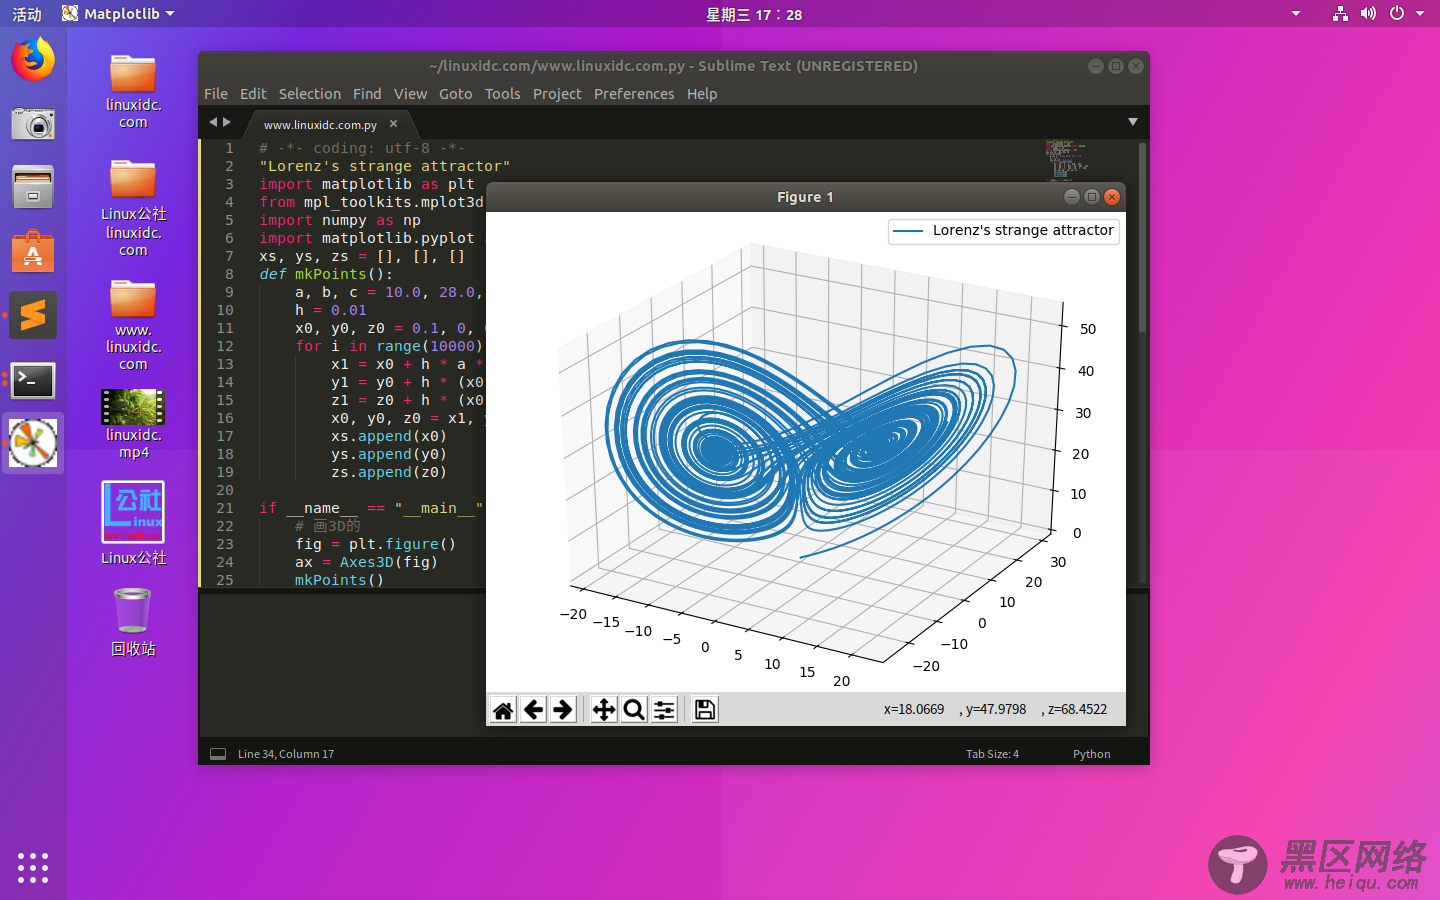
# -*- coding: utf-8 -*- "Lorenz's strange attractor" import matplotlib as plt from mpl_toolkits.mplot3d import Axes3D import numpy as np import matplotlib.pyplot as plt xs, ys, zs = [], [], [] def mkPoints(): a, b, c = 10.0, 28.0, 8.0 / 3.0 h = 0.01 x0, y0, z0 = 0.1, 0, 0 for i in range(10000): x1 = x0 + h * a * (y0 - x0) y1 = y0 + h * (x0 * (b - z0) - y0) z1 = z0 + h * (x0 * y0 - c * z0) x0, y0, z0 = x1, y1, z1 xs.append(x0) ys.append(y0) zs.append(z0) if __name__ == "__main__": # 画3D的 fig = plt.figure() ax = Axes3D(fig) mkPoints() ax.plot(xs, ys, zs, label="Lorenz's strange attractor") ax.legend() plt.show() # 画2D的 # mkPoints() # plt.plot(zs, ys) # plt.show()
运行效果如下:


