
启动nginx:
[root@01server /usr/local/nginx/conf]# cd ../sbin/ [root@01server /usr/local/nginx/sbin]# ./nginx -t # 检查nginx的配置文件是否正常 nginx: the configuration file /usr/local/nginx/conf/nginx.conf syntax is ok nginx: configuration file /usr/local/nginx/conf/nginx.conf test is successful [root@01server /usr/local/nginx/sbin]# ./nginx -c /usr/local/nginx/conf/nginx.conf # 启动nginx [root@01server /usr/local/nginx/sbin]# netstat -lntp |grep nginx tcp 0 0 0.0.0.0:80 0.0.0.0:* LISTEN 22713/nginx: master [root@01server /usr/local/nginx/sbin]#启动成功后,使用浏览器访问/nginx_status,访问成功响应的信息如下:
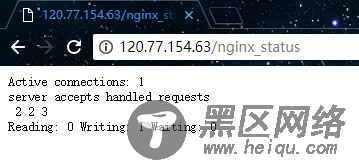
说明:
Active connections 当前活动的连接数量(包括等待的)
accepts 已接收的连接总数
handled 已处理的连接总数
requests 当前的请求总数
Reading nginx正在读取的连接数量
Writing nginx正在响应的连接数量
Waiting 当前空闲的连接数量
如上,通过这些简单的参数可以看到nginx当前的连接信息。在高并发场景下,可以根据Active connections参数判断当前的一个并发数量,Reading 参数则可以告诉我们当前nginx是否繁忙。当然,这只是最简单的一个nginx的监控方式,参数也就只有那么几个。但这些都是其他更高级的监控工具的基础,所以了解这些基础监控也是有必要的。
ngxtop监控请求信息在上一小节中,我们介绍了如何利用 ngx_http_stub_status 模块去监控nginx的连接信息。本小节将介绍如何使用ngxtop工具来监控nginx的请求信息。
ngxtop可以实时解析nginx访问日志,并且将处理结果输出到终端,功能类似于系统命令top,所以这个软件起名ngxtop。有了ngxtop,你可以实时了解到当前nginx的访问状况,再也不需要tail日志看屏幕刷新。
ngxtop项目地址:
https://github.com/lebinh/ngxtop
安装ngxtop:
由于ngxtop是Python编写的,我们可以使用pip进行安装。如果你的机器上没有安装pip,需要先把pip装上,安装命令如下:
[root@01server ~]# yum install -y epel-release [root@01server ~]# yum install -y python-pip然后通过pip安装ngxtop,命令如下:
[root@01server ~]# pip install ngxtopngxtop使用说明:
[root@01server ~]# ngxtop --help ngxtop - ad-hoc query for nginx access log. Usage: ngxtop [options] ngxtop [options] (print|top|avg|sum) <var> ... ngxtop info ngxtop [options] query <query> ... Options: -l <file>, --access-log <file> # 需要分析的访问日志 -f <format>, --log-format <format> # log_format指令指定的日志格式 [默认: combined] --no-follow ngxtop default behavior is to ignore current lines in log and only watch for new lines as they are written to the access log. Use this flag to tell ngxtop to process the current content of the access log instead. # 简而言之,对历史信息进行统计 -t <seconds>, --interval <seconds> report interval when running in follow mode [default: 2.0] # 指定监控信息刷新的间隔,单位为秒 [默认: 2.0] -g <var>, --group-by <var> # 根据变量分组 [默认: request_path] -w <var>, --having <expr> # 具备子句 [默认: 1] having clause [default: 1] -o <var>, --order-by <var> # 排序 [默认: count] -n <number>, --limit <number> # 显示的条数 [默认: 10] -a <exp> ..., --a <exp> ... add exp (must be aggregation exp: sum, avg, min, max, etc.) into output # 添加聚合表达式到输出信息中 -v, --verbose # 更多的输出 -d, --debug # 打印所有行和解析记录,debug -h, --help # 当前帮助信息. --version # 输出版本信息.高级选项:
-c <file>, --config <file> # 运行ngxtop解析nginx配置文件 -i <filter-expression>, --filter <filter-expression> filter in, records satisfied given expression are processed. # 根据指定的表达式进行过滤,仅显示过滤后的信息 -p <filter-expression>, --pre-filter <filter-expression> in-filter expression to check in pre-parsing phase. # 在筛选器表达式中检查预解析阶段