from math import *
from numpy import *
x = arange(-math.pi, math.pi, 0.01)
y = [sin(xx) for xx in x]
plt.figure()
plt.plot(x, y, color='r', linestyle='-.')
plt.show()
效果如下:

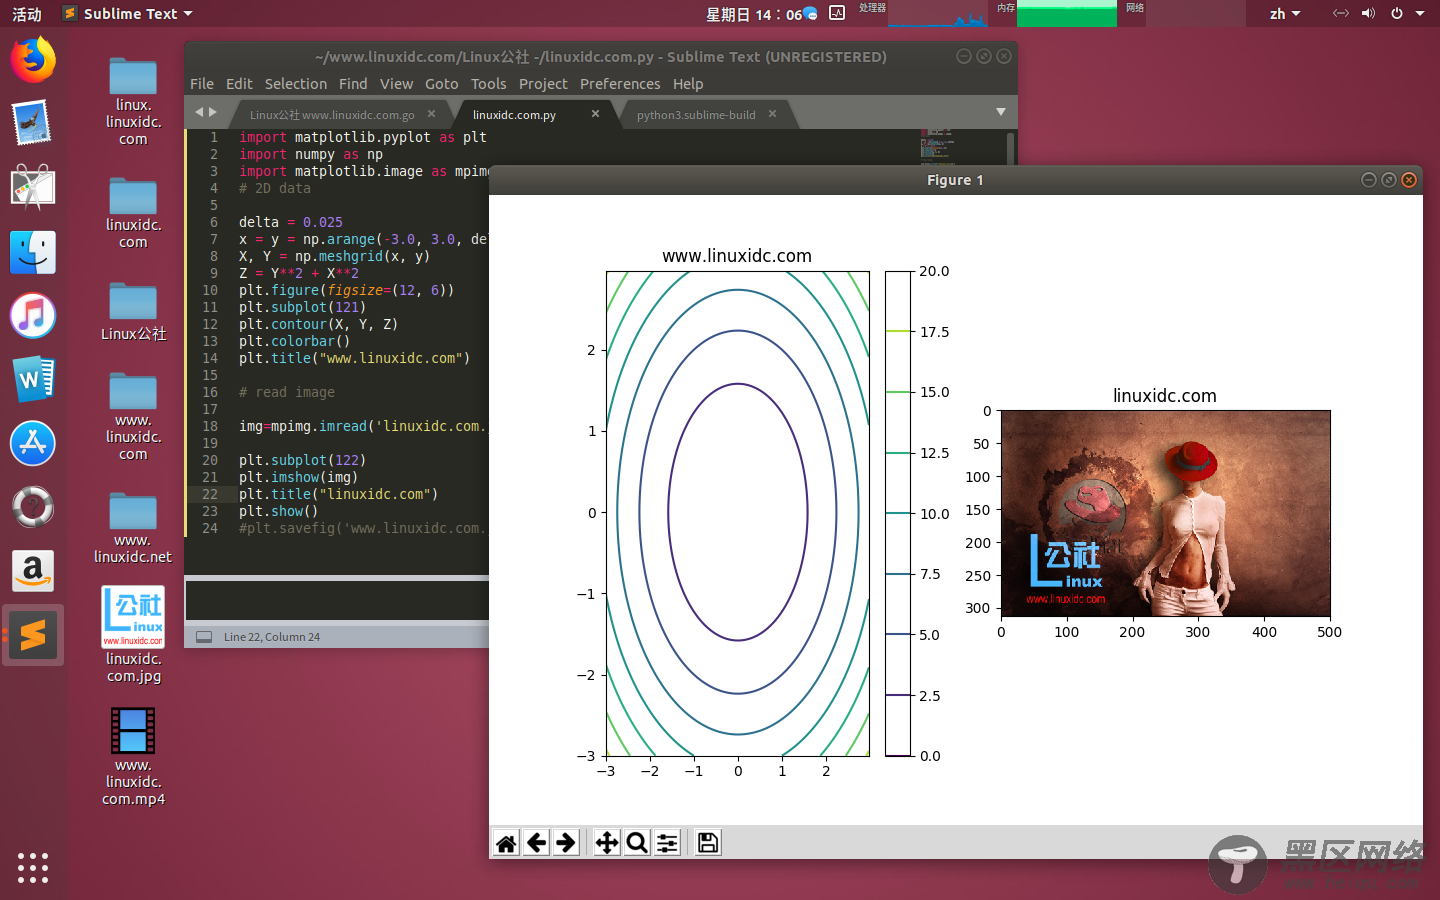
C、二维图形(等高线,本地图片等)
import matplotlib.pyplot as plt
import numpy as np
import matplotlib.image as mpimg
# 2D data
delta = 0.025
x = y = np.arange(-3.0, 3.0, delta)
X, Y = np.meshgrid(x, y)
Z = Y**2 + X**2
plt.figure(figsize=(12, 6))
plt.subplot(121)
plt.contour(X, Y, Z)
plt.colorbar()
plt.title("www.linuxidc.com")
# read image
img=mpimg.imread('linuxidc.com.jpg')
plt.subplot(122)
plt.imshow(img)
plt.title("linuxidc.com")
plt.show()
#plt.savefig('www.linuxidc.com.jpg")
效果图:
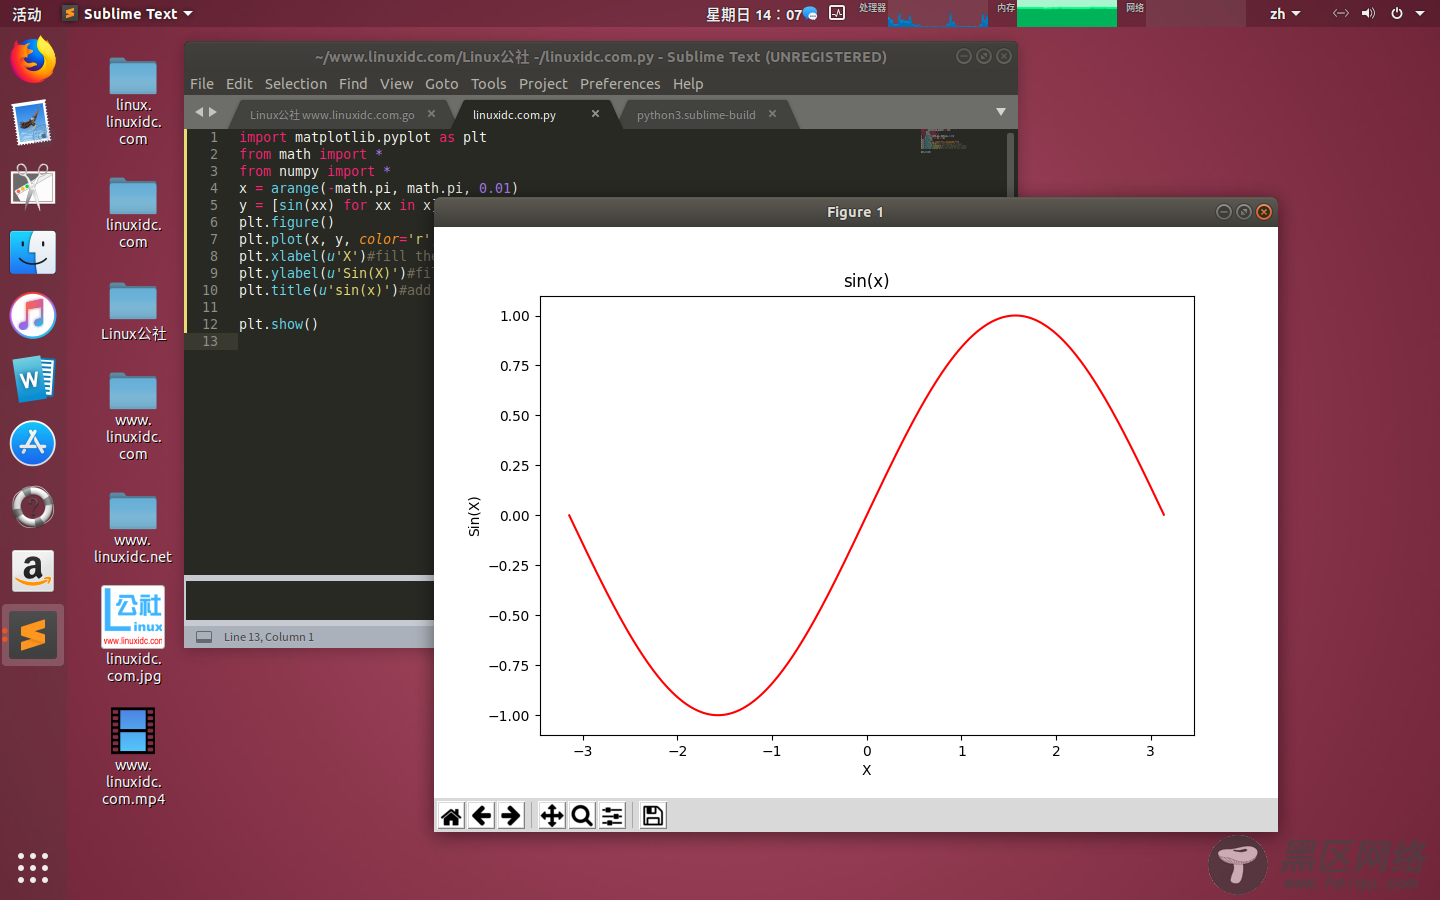
D、对所画图进行补充
import matplotlib.pyplot as plt
from math import *
from numpy import *
x = arange(-math.pi, math.pi, 0.01)
y = [sin(xx) for xx in x]
plt.figure()
plt.plot(x, y, color='r', linestyle='-')
plt.xlabel(u'X')#fill the meaning of X axis
plt.ylabel(u'Sin(X)')#fill the meaning of Y axis
plt.title(u'sin(x)')#add the title of the figure
plt.show()
效果图:
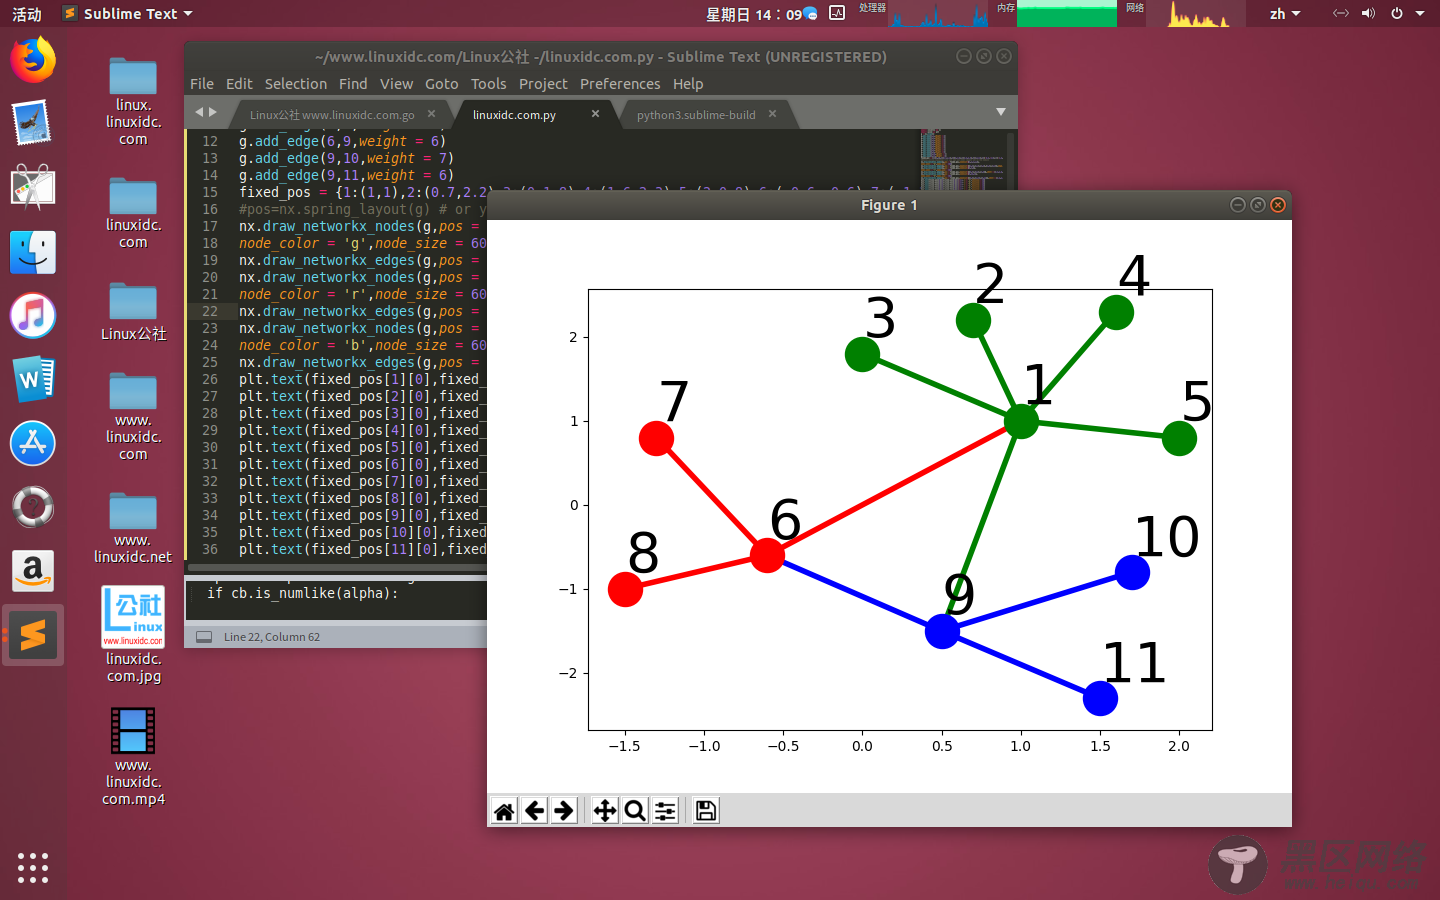
画网络图,要用到networkx这个库,下面给出一个实例:
import networkx as nx
import pylab as plt
g = nx.Graph()
g.add_edge(1,2,weight = 4)
g.add_edge(1,3,weight = 7)
g.add_edge(1,4,weight = 8)
g.add_edge(1,5,weight = 3)
g.add_edge(1,9,weight = 3)
g.add_edge(1,6,weight = 6)
g.add_edge(6,7,weight = 7)
g.add_edge(6,8,weight = 7)
g.add_edge(6,9,weight = 6)
g.add_edge(9,10,weight = 7)
g.add_edge(9,11,weight = 6)
fixed_pos = {1:(1,1),2:(0.7,2.2),3:(0,1.8),4:(1.6,2.3),5:(2,0.8),6:(-0.6,-0.6),7:(-1.3,0.8), 8:(-1.5,-1), 9:(0.5,-1.5), 10:(1.7,-0.8), 11:(1.5,-2.3)} #set fixed layout location
#pos=nx.spring_layout(g) # or you can use other layout set in the module
nx.draw_networkx_nodes(g,pos = fixed_pos,nodelist=[1,2,3,4,5],
node_color = 'g',node_size = 600)
nx.draw_networkx_edges(g,pos = fixed_pos,edgelist=[(1,2),(1,3),(1,4),(1,5),(1,9)],edge_color='g',width = [4.0,4.0,4.0,4.0,4.0],label = [1,2,3,4,5],node_size = 600)
nx.draw_networkx_nodes(g,pos = fixed_pos,nodelist=[6,7,8],
node_color = 'r',node_size = 600)
nx.draw_networkx_edges(g,pos = fixed_pos,edgelist=[(6,7),(6,8),(1,6)],width = [4.0,4.0,4.0],edge_color='r',node_size = 600)
nx.draw_networkx_nodes(g,pos = fixed_pos,nodelist=[9,10,11],
node_color = 'b',node_size = 600)
nx.draw_networkx_edges(g,pos = fixed_pos,edgelist=[(6,9),(9,10),(9,11)],width = [4.0,4.0,4.0],edge_color='b',node_size = 600)
plt.text(fixed_pos[1][0],fixed_pos[1][1]+0.2, s = '1',fontsize = 40)
plt.text(fixed_pos[2][0],fixed_pos[2][1]+0.2, s = '2',fontsize = 40)
plt.text(fixed_pos[3][0],fixed_pos[3][1]+0.2, s = '3',fontsize = 40)
plt.text(fixed_pos[4][0],fixed_pos[4][1]+0.2, s = '4',fontsize = 40)
plt.text(fixed_pos[5][0],fixed_pos[5][1]+0.2, s = '5',fontsize = 40)
plt.text(fixed_pos[6][0],fixed_pos[6][1]+0.2, s = '6',fontsize = 40)
plt.text(fixed_pos[7][0],fixed_pos[7][1]+0.2, s = '7',fontsize = 40)
plt.text(fixed_pos[8][0],fixed_pos[8][1]+0.2, s = '8',fontsize = 40)
plt.text(fixed_pos[9][0],fixed_pos[9][1]+0.2, s = '9',fontsize = 40)
plt.text(fixed_pos[10][0],fixed_pos[10][1]+0.2, s = '10',fontsize = 40)
plt.text(fixed_pos[11][0],fixed_pos[11][1]+0.2, s = '11',fontsize = 40)
plt.show()
效果图如下: