
近期发现业务高峰期时刻会出现CPU繁忙导致的timeout异常,通过监控来看是因为Node上面的一些Pod突发抢占了大量CPU导致的。
问: 没有限制CPU吗?是不是限制的CPU使用值就可以解决了呢?
解: 其实不能根本解决这个问题,因为使用的容器引擎是Docker,而Docker是使用了cgroups技术,这就引入了一个老大难的问题,cgroup的隔离性。当问题发生时并没有办法把异常CPU进程直接摁住,而会有短暂的高峰,现象为:限制了CPU为2核,突发时CPU可能是4、5、6等,然后容器会被kill掉,K8S会尝试重建容器。
使用隔离性更好的容器引擎,如 kata(VM级别)。
优化程序
方案1我们可以知道方案1解决的比较彻底,而且只需要全局处理一次即可,但技术比较新颖,不知道会不会带来其它问题,我们之后准备拿出部分Node尝试kata container。
方案2对应用开发者要求比较高,需要对应的开发者针对性介入,短期收益很高,我们先部署了这种。
如何实施?我们知道程序在运行中,除非特别严重的BUG,CPU高峰一般非常短暂,这时候靠人肉抓包基本上是来不及的,也很耗费精力,我们就希望有一个程序能在CPU达到一定阈值的时候自动抓取线程堆栈来事后针对性优化,并且一定时间内只允许运行一次防止循环抓包导致程序不可用。
根据要实现的最终效果我们发现与Grafana、Prometheus的告警机制十分接近,我们要做的就是接收告警的webhook,去对应的容器中获取线程堆栈就行。
于是我们利用了 Grafana ,写了一个程序来完成这个功能。
项目信息开发语言: Go、Shell
项目地址: https://github.com/majian159/k8s-java-debug-daemon
利用了 Grafana 的告警机制,配合阿里的 arthas,来完成高CPU使用率线程的堆栈抓取。
整体流程如下:
为 Grafana 添加 webhook 类型的告警通知渠道,地址为该程序的 url(默认的hooks路径为 /hooks)。
配置Grafana图表,并设置告警阈值
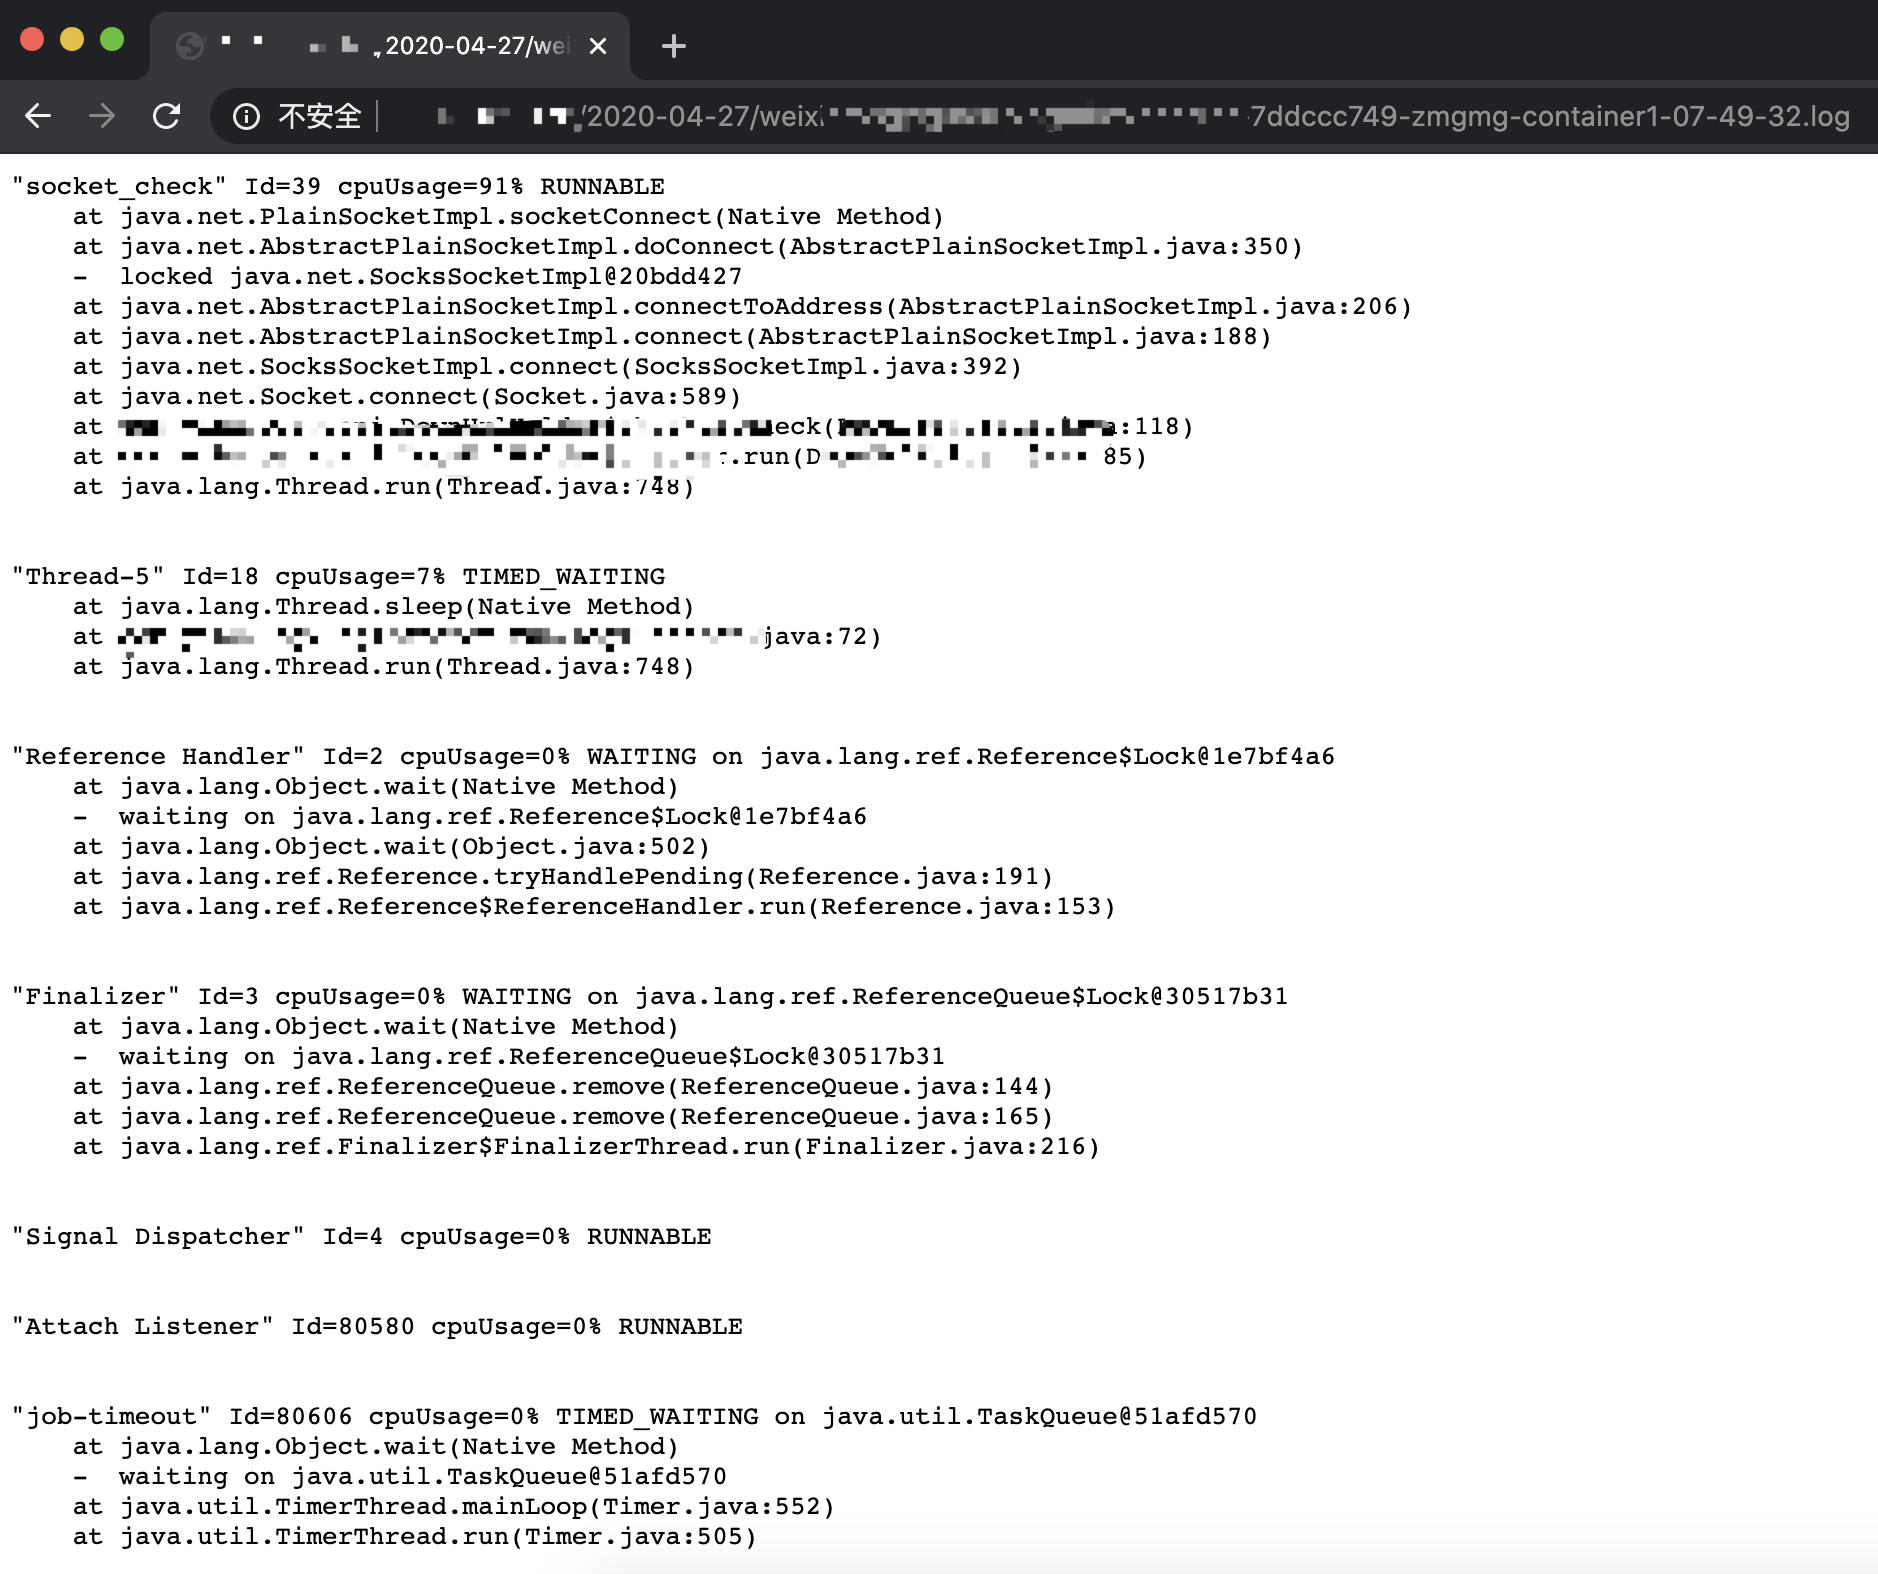
当 webhook 触发时,程序会自动将 craw.sh 脚本拷贝到对应 Pod 的容器中并执行。
程序将 stdout 保存到本地文件。
效果预览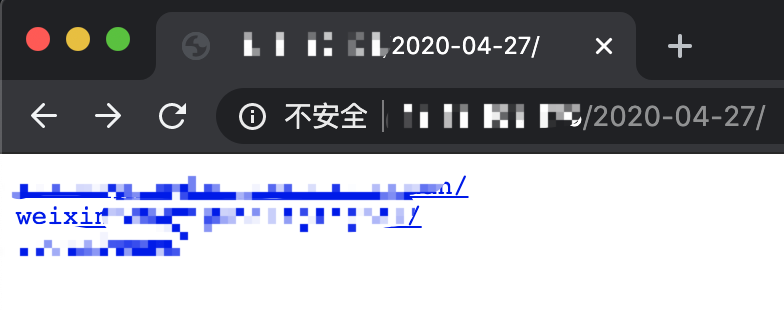
每 node 同时运行执行数为10
可以在 ./internal/defaultvalue.go 中更改var defaultNodeLockManager = nodelock.NewLockManager(10)
默认使用集群内的Master配置
可以在 ./internal/defaultvalue.go 中更改func DefaultKubernetesClient(){}
// default
func getConfigByInCluster(){}
func getConfigByOutOfCluster(){}
默认使用并实现了一个基于本地文件的堆栈存储器, 路径位于工作路径下的 stacks中
可以在 ./internal/defaultvalue.go 中更改func GetDefaultNodeLockManager(){}
默认取最繁忙的前50个线程的堆栈信息 (可在 craw.sh 中修改)
采集样本时间为2秒 (可在 craw.sh 中修改)
如何使用 Docker Imagemajian159/java-debug-daemon
为 Grafana 新建一个通知频道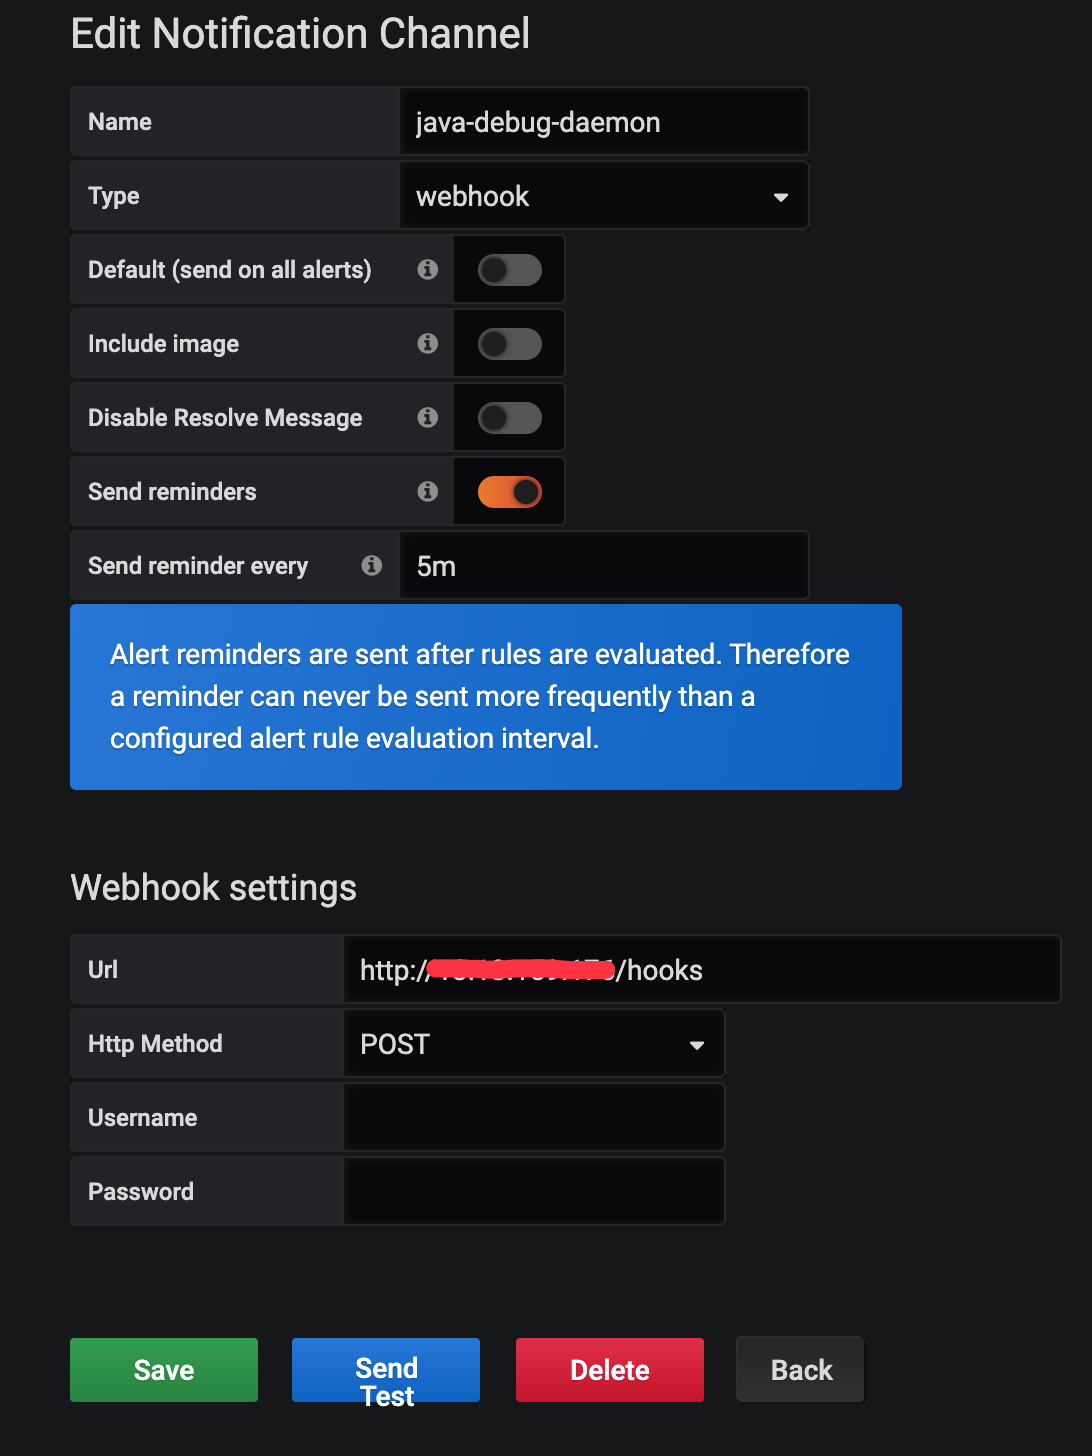
需要打开 Send reminders, 不然 Grafana 默认在触发告警后一直没有解决不会重复发送告警
Send reminder every 可以控制最快多久告警一次
为 Grafana 新建一个告警图表如果嫌麻烦可以直接导入以下配置, 在自行更改
{ "datasource": "prometheus", "alert": { "alertRuleTags": {}, "conditions": [ { "evaluator": { "params": [ 1 ], "type": "gt" }, "operator": { "type": "and" }, "query": { "params": [ "A", "5m", "now" ] }, "reducer": { "params": [], "type": "last" }, "type": "query" } ], "executionErrorState": "keep_state", "for": "10s", "frequency": "30s", "handler": 1, "name": "Pod 高CPU堆栈抓取", "noDataState": "no_data", "notifications": [ { "uid": "AGOJRCqWz" } ] }, "aliasColors": {}, "bars": false, "dashLength": 10, "dashes": false, "fill": 1, "fillGradient": 0, "gridPos": { "h": 9, "w": 24, "x": 0, "y": 2 }, "hiddenSeries": false, "id": 14, "legend": { "alignAsTable": true, "avg": true, "current": true, "max": true, "min": false, "rightSide": true, "show": true, "total": false, "values": true }, "lines": true, "linewidth": 1, "nullPointMode": "null", "options": { "dataLinks": [] }, "percentage": false, "pointradius": 2, "points": false, "renderer": "flot", "seriesOverrides": [], "spaceLength": 10, "stack": false, "steppedLine": false, "targets": [ { "expr": "container_memory_working_set_bytes{job=\"kubelet\", metrics_path=\"/metrics/cadvisor\", image!=\"\", container!=\"POD\"}* on (namespace, pod) group_left(node) max by(namespace, pod, node, container) (kube_pod_info)", "legendFormat": "{{node}} - {{namespace}} - {{pod}} - {{container}}", "refId": "A" } ], "thresholds": [ { "colorMode": "critical", "fill": true, "line": true, "op": "gt", "value": 1 } ], "timeFrom": null, "timeRegions": [], "timeShift": null, "title": "Pod CPU", "tooltip": { "shared": true, "sort": 0, "value_type": "individual" }, "type": "graph", "xaxis": { "buckets": null, "mode": "time", "name": null, "show": true, "values": [] }, "yaxes": [ { "format": "short", "label": null, "logBase": 1, "max": null, "min": null, "show": true }, { "format": "short", "label": null, "logBase": 1, "max": null, "min": null, "show": true } ], "yaxis": { "align": false, "alignLevel": null } } Queries配置