想要获取 Canvas 的像素信息,需要通过 ctx.getImageData(sx, sy, sw, sh),该 API 会返回你所指定画布区域的像素对象。该对象包含 data、width、height。其中 data 是一个含有每个像素点 RGBA 信息的一维数组,如下图所示。
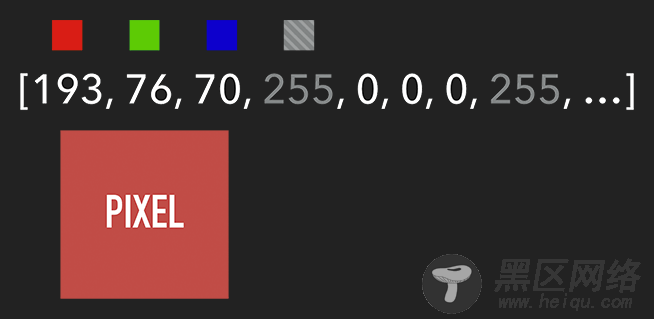
含有 RGBA 信息的一维数组
获取到特定区域的像素后,我们就能对每个像素进行处理(如各种滤镜效果)。处理完后,则可通过 ctx.putImageData() 将其渲染在指定的 Canvas 上。
扩展:由于 Canvas 目前没有提供“历史记录”的功能,如需实现“返回上一步”操作,则可通过 getImageData 保存上一步操作,当需要时则可通过 putImageData 进行复原。
示例代码:
let imageScore = 0 const rgba = imageData.data for (let i = 0; i < rgba.length; i += 4) { const r = rgba[i] / 3 const g = rgba[i + 1] / 3 const b = rgba[i + 2] / 3 const pixelScore = r + g + b // 如果该像素足够明亮 if (pixelScore >= PIXEL_SCORE_THRESHOLD) { imageScore++ } } // 如果明亮的像素数量满足一定条件 if (imageScore >= IMAGE_SCORE_THRESHOLD) { // 产生了移动 }
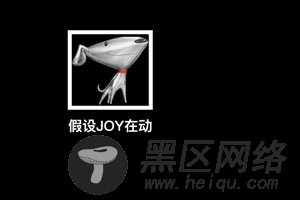
在上述案例中,你也许会注意到画面是『绿色』的。其实,我们只需将每个像素的红和蓝设置为 0,即将 RGBA 的 r = 0; b = 0 即可。这样就会像电影的某些镜头一样,增加了科技感和神秘感。
const rgba = imageData.data for (let i = 0; i < rgba.length; i += 4) { rgba[i] = 0 // red rgba[i + 2] = 0 // blue } ctx.putImageData(imageData, 0, 0)

将 RGBA 中的 R 和 B 置为 0
跟踪“移动物体”
有了明亮的像素后,我们就要找出其 x 坐标的最小值与 y 坐标的最小值,以表示跟踪矩形的左上角。同理,x 坐标的最大值与 y 坐标的最大值则表示跟踪矩形的右下角。至此,我们就能绘制出一个能包围所有明亮像素的矩形,从而实现跟踪移动物体的效果。
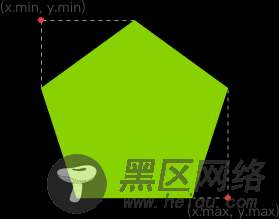
找出跟踪矩形的左上角和右下角
示例代码:
function processDiff (imageData) { const rgba = imageData.data let score = 0 let pixelScore = 0 let motionBox = 0 // 遍历整个 canvas 的像素,以找出明亮的点 for (let i = 0; i < rgba.length; i += 4) { pixelScore = (rgba[i] + rgba[i+1] + rgba[i+2]) / 3 // 若该像素足够明亮 if (pixelScore >= 80) { score++ coord = calcCoord(i) motionBox = calcMotionBox(montionBox, coord.x, coord.y) } } return { score, motionBox } } // 得到左上角和右下角两个坐标值 function calcMotionBox (curMotionBox, x, y) { const motionBox = curMotionBox || { x: { min: coord.x, max: x }, y: { min: coord.y, max: y } } motionBox.x.min = Math.min(motionBox.x.min, x) motionBox.x.max = Math.max(motionBox.x.max, x) motionBox.y.min = Math.min(motionBox.y.min, y) motionBox.y.max = Math.max(motionBox.y.max, y) return motionBox } // imageData.data 是一个含有每个像素点 rgba 信息的一维数组。 // 该函数是将上述一维数组的任意下标转为 (x,y) 二维坐标。 function calcCoord(i) { return { x: (i / 4) % diffWidth, y: Math.floor((i / 4) / diffWidth) } }
在得到跟踪矩形的左上角和右下角的坐标值后,通过 ctx.strokeRect(x, y, width, height) API 绘制出矩形即可。
ctx.lineWidth = 6 ctx.strokeRect( diff.motionBox.x.min + 0.5, diff.motionBox.y.min + 0.5, diff.motionBox.x.max - diff.motionBox.x.min, diff.motionBox.y.max - diff.motionBox.y.min )
这是理想效果,实际效果请打开 体验链接