
本文将详细介绍以下这些Linux命令及其扩展选项的意义,及其在实践中的作用。并利用一个实际出现问题的例子,来验证这些套路是不是可行,下面工具的屏幕输出结果都来自这个出现问题的系统。当遇到一个系统性能问题时,如何利用登录的前60秒对系统的性能情况做一个快速浏览和分析,主要包括如下10个工具,这是一个非常有用且有效的工具列表。
# 系统负载概览
uptime
# 系统日志
dmesg | tail
# CPU
vmstat 1
mpstat -P ALL 1
pidstat 1
# Disk
iostat -xz 1
# 内存
free -m
# 网络
sar -n DEV 1
sar -n TCP,ETCP 1
# 系统概览
top
上面的工具都基于内核提供给用户态的统计,并以计数器形式展示,是快速排查时的利器。对于应用和系统的进一步跟踪(tracing),则需要利用strace和systemtap等工具,不在本文的范畴。
注意:
如上基于CPU, 内存,I/O,网络等的分类只是基于工具默认选项的分类,比如pidstat,默认展示进程的CPU统计,但是利用-d参数可以展示进程的I/O统计。又比如vmstat,虽然名称是查看虚拟内存的工具,但默认展示了负载,内存,I/O,系统,CPU等多方面的信息。
部分工具需要安装sysstat包。
1. uptime[root@nginx1 ~]# uptime 15:38:10 up 43 days, 3:54, 1 user, load average: 1.13, 0.41, 0.18
uptime是快速查看load average的方法,在Linux中load average包括处于runnable和uninterruptable状态的进程总数,runnable状态包括在CPU上运行的进程和在run queue里waiting for run time等待CPU的进程;uninterruptable状态的进程是在等待一些I/O访问,比如等待disk的返回。Load average没有根据系统的CPU数量做格式化,所以load average 1表示单CPU系统在对应时间段内(1分钟, 5分钟, 15分钟)一直负载饱和,而在4 CPU的系统中,load average 1表示有75%的时间在idle。
Load average体现了一个high level的负载概览,但是可能需要和别的工具一起来使用以了解更多信息,比如处于runable和uninterruptable的实时进程数量分别是多少,可以用下面将介绍到的vmstat来查看。1分钟,5分钟,15分钟的负载平均值同时能体现系统负载的变化情况。例如,如果你要检查一个问题服务器,当你看到1分钟的平均负载值已经远小于15分钟的平均负载值,则意味这也许你登录晚了点,错过了现场。用top或者w命令,也可以看到load average信息。
上面示例中最近1分钟内的负载比15分钟内的负载高了不少 (因为是个测试的例子,1.13可以看作明显大于0.18,但是在生产系统上这不能说明什么)。
2. dmesg | tail[root@nginx1 ~]# dmesg | tail [3128052.929139] device eth0 left promiscuous mode [3128104.794514] device eth0 entered promiscuous mode [3128526.750271] device eth0 left promiscuous mode [3537292.096991] device eth0 entered promiscuous mode [3537295.941952] device eth0 left promiscuous mode [3537306.450497] device eth0 entered promiscuous mode [3537307.884028] device eth0 left promiscuous mode [3668025.020351] bash (8290): drop_caches: 1 [3674191.126305] bash (8290): drop_caches: 2 [3675304.139734] bash (8290): drop_caches: 1
dmesg用于查看内核缓冲区存放的系统信息。另外查看/var/log/messages也可能查看出服务器系统方面的某些问题。
上面示例中的dmesg没有特别的值得注意的错误。
3. vmstat 1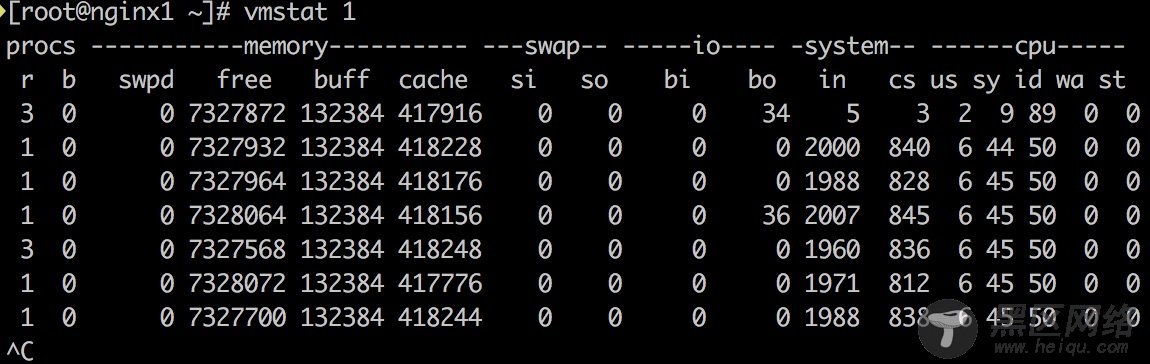
vmstat简介:
vmstat是virtual memory stat的简写,能够打印processes, memory, paging, block IO, traps, disks and cpu的相关信息。
vmstat的格式:vmstat [options] [delay [count]]。在输入中的1是延迟。第一行打印的是机器启动到现在的平均值,后面打印的则是根据deley间隔的取样结果,也就是实时的结果。
结果中列的含义:
Procs(进程)
r: The number of runnable processes (running or waiting for run time).
b: The number of processes in uninterruptible sleep.
注释:r表示在CPU上运行的进程和ready等待运行的进程总数,相比load average, 这个值更能判断CPU是否饱和(saturation),因为它没有包括I/O。如果r的值大于CPU数目,即达到饱和。
Memory
swpd: the amount of virtual memory used.
free: the amount of idle memory.
buff: the amount of memory used as buffers.
cache: the amount of memory used as cache.
Swap
si: Amount of memory swapped in from disk (/s).
so: Amount of memory swapped to disk (/s).
注释:swap-in和swap-out的内存。如果是非零,说明主存中的内存耗尽。
IO
bi: Blocks received from a block device (blocks/s).
bo: Blocks sent to a block device (blocks/s).
System (中断和进程上下文切换)
in: The number of interrupts per second, including the clock.
cs: The number of context switches per second.
CPU