avgqu-sz:队列里的平均I/O请求数量 (更恰当的理解应该是平均未完成的I/O请求数量)。如果该值大于1,则有饱和的趋势 (当然设备可以并发地处理请求,特别是一个front对多个backend disk的虚拟设备)。
%util:设备在处理I/O的时间占总时间的百分比。表示该设备有I/O(即非空闲)的时间比率,不考虑I/O有多少,只考虑有没有。通常该指标达到60%即可能引起性能问题 (可以根据await指标进一步求证)。如果指标接近100%,通常就说明出现了饱和。
如果存储设备是一个对应多个后端磁盘的逻辑磁盘,那么100%使用率可能仅仅表示一些I/O在处理时间占比达到100%,其他后端磁盘不一定也到达了饱和。请注意磁盘I/O的性能问题并不一定会造成应用的问题,很多技术都是使用异步I/O操作,所以应用不一定会被block或者直接受到延迟的影响。
7. free -m# free -m total used free shared buff/cache available Mem: 7822 129 214 0 7478 7371 Swap: 0 0 0
查看内存使用情况。倒数第二列:
buffers: buffer cache,用于block device I/O。
cached: page cache, 用于文件系统。
Linux用free memory来做cache, 当应用需要时,这些cache可以被回收。比如kswapd内核进程做页面回收时可能回收cache;另外手动写/proc/sys/vm/drop_caches也会导致cache回收。
上面示例中free的内存只有129M,大部分memory被cache占用。但是系统并没有问题。
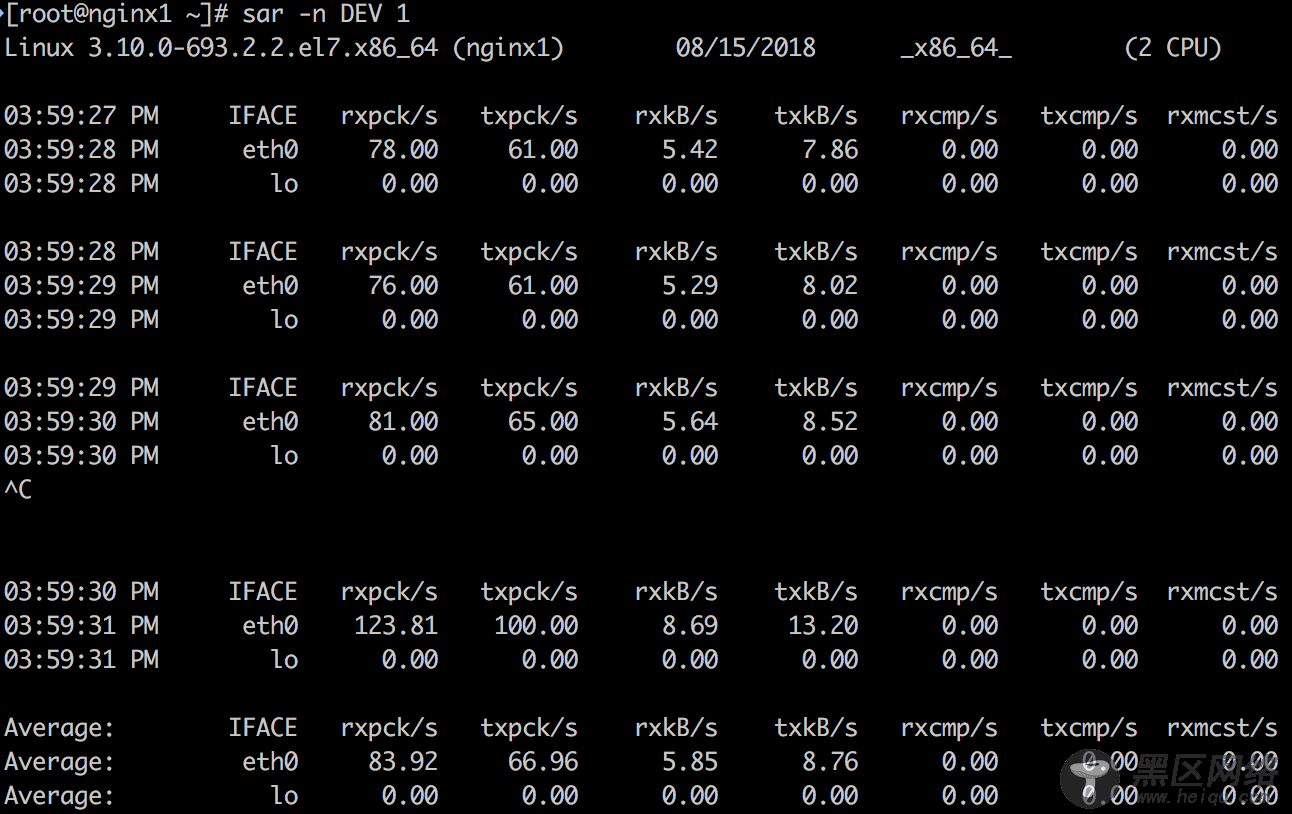
8. sar -n DEV 1
输出指标的含义如下:
rxpck/s: Total number of packets received per second.
txpck/s: Total number of packets transmitted per second.
rxkB/s: Total number of kilobytes received per second.
txkB/s: Total number of kilobytes transmitted per second.
rxcmp/s: Number of compressed packets received per second (for cslip etc.).
txcmp/s: Number of compressed packets transmitted per second.
rxmcst/s: Number of multicast packets received per second.
%ifutil: Utilization percentage of the network interface. For half-duplex interfaces, utilization is calculated using the sum of rxkB/s and txkB/s as a percentage of the interface speed.
For full-duplex, this is the greater of rxkB/S or txkB/s.
这个工具可以查看网络接口的吞吐量,特别是上面蓝色高亮的rxkB/s和txkB/s,这是网络负载,也可以看是否达到了limit。
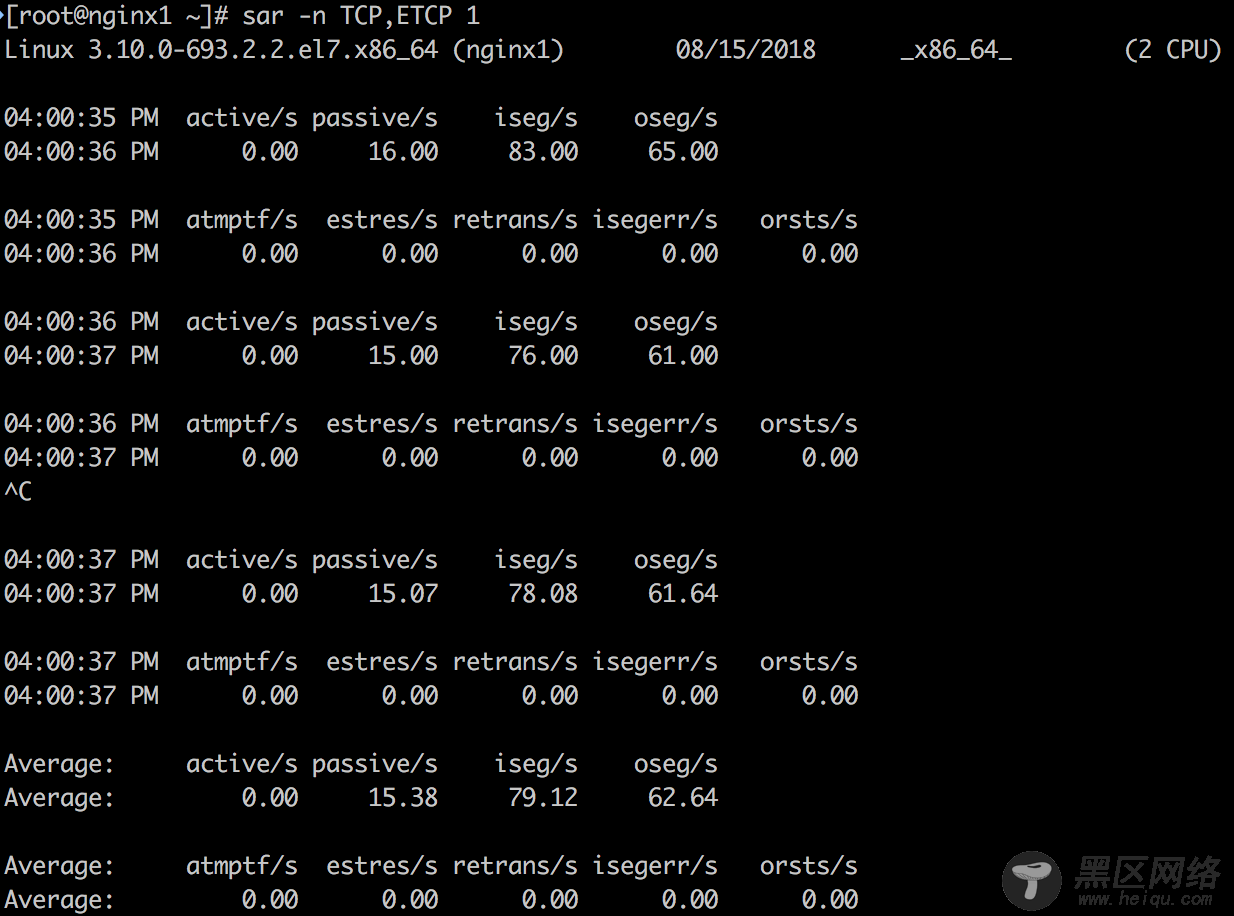
9. sar -n TCP,ETCP 1
输出指标的含义如下:
active/s: The number of times TCP connections have made a direct transition to the SYN-SENT state from the CLOSED state per second [tcpActiveOpens].
passive/s: The number of times TCP connections have made a direct transition to the SYN-RCVD state from the LISTEN state per second [tcpPassiveOpens].
iseg/s: The total number of segments received per second, including those received in error [tcpInSegs]. This count includes segments received on currently established connections.
oseg/s: The total number of segments sent per second, including those on current connections but excluding those containing only retransmitted octets [tcpOutSegs].
atmptf/s: The number of times per second TCP connections have made a direct transition to the CLOSED state from either the SYN-SENT state or the SYN-RCVD state, plus the number of times per second TCP connections have made a direct transition to the LISTEN state from the SYN-RCVD state [tcpAttemptFails].
estres/s: The number of times per second TCP connections have made a direct transition to the CLOSED state from either the ESTABLISHED state or the CLOSE-WAIT state [tcpEstabResets].
retrans/s: The total number of segments retransmitted per second - that is, the number of TCP segments transmitted containing one or more previously transmitted octets [tcpRetransSegs].
isegerr/s: The total number of segments received in error (e.g., bad TCP checksums) per second [tcpInErrs].
orsts/s: The number of TCP segments sent per second containing the RST flag [tcpOutRsts].
上述蓝色高亮的3个指标:active/s, passive/s和retrans/s是比较有代表性的指标。
active/s和passive/s分别是本地发起的每秒新建TCP连接数和远程发起的TCP新建连接数。这两个指标可以粗略地判断服务器的负载。可以用active衡量出站发向,用passive衡量入站方向,但也不是完全准确(比如,考虑localhost到localhost的连接)。
retrans是网络或者服务器发生问题的象征。有可能问题是网络不稳定,比如Internet网络问题,或者服务器过载丢包。
10. top
