举例分析CMS垃圾收集器执行过程
-verbose:gc
//会输出详细的垃圾回收的日志
-Xms20M
//堆容量的初始大小
-Xmx20M
//堆容量的最大大小 -- 两个值一般设置为一样的,这样不会出现抖动的现象。
-Xmn10M
//新生代的大小是10M
-XX:+PrintGCDetails
//打印出垃圾回收详细的信息
-XX:SurvivorRatio=8
//eden和 survivor的比例为8:1的比例。
-XX:UseConcMarkSweepGC
//指定老年代的收集器
/**
*/
// 执行前添加上述参数
public class MyTest5 {
public static void main(String[] args) {
int size = 1024 * 1024; // 1M 的容量
byte[] myAlloc1 = new byte[4 * size];
sout("111111");
byte[] myAlloc2 = new byte[4 * size];
sout("222222");
byte[] myAlloc3 = new byte[4 * size];
sout("3333333");
byte[] myAlloc4 = new byte[2 * size]; // 这个地方设置成4的话,也会报错。
sout("44444444");
}
}
》 CMS垃圾收集器 垃圾回收的7步骤。
> Task :MyTest5.main()
111111
[GC (Allocation Failure) [ParNew: 4767K->353K(9216K), 0.0023425 secs] 4767K->4451K(19456K), 0.0023675 secs] [Times: user=0.03 sys=0.00, real=0.00 secs]
222222
[GC (Allocation Failure) [ParNew: 4607K->437K(9216K), 0.0027693 secs] 8705K->8633K(19456K), 0.0028041 secs] [Times: user=0.03 sys=0.01, real=0.00 secs]
[GC (CMS Initial Mark) // 第一步
[1 CMS-initial-mark: 8196K'已使用空间大小'(10240K'老年代总的空间大小')] 12729K(19456K'堆的总空间'), 0.0004582 secs] [Times: user=0.00 sys=0.00, real=0.00 secs]
[CMS-concurrent-mark-start] // 第二部
3333333
[CMS-concurrent-mark: 0.000/0.000 secs] [Times: user=0.00 sys=0.00, real=0.00 secs]
[CMS-concurrent-preclean-start] // 第三部
[CMS-concurrent-preclean: 0.000/0.000 secs] [Times: user=0.00 sys=0.00, real=0.00 secs]
[CMS-concurrent-abortable-preclean-start] // 第四部
[CMS-concurrent-abortable-preclean: 0.000/0.000 secs] [Times: user=0.00 sys=0.00, real=0.00 secs]
[GC (CMS Final Remark) // 第五步
[YG occupancy: 6904 K (9216 K)][Rescan (parallel) , 0.0005171 secs][weak refs processing, 0.0000047 secs][class unloading, 0.0003175 secs][scrub symbol table, 0.0002325 secs][scrub string table, 0.0001332 secs][1 CMS-remark: 8196K(10240K)] 15100K(19456K), 0.0012469 secs] [Times: user=0.01 sys=0.00, real=0.00 secs]
[CMS-concurrent-sweep-start] //第六部
44444444
[CMS-concurrent-sweep: 0.000/0.000 secs] [Times: user=0.00 sys=0.00, real=0.00 secs]
[CMS-concurrent-reset-start] // 第七部
[CMS-concurrent-reset: 0.000/0.000 secs] [Times: user=0.00 sys=0.00, real=0.00 secs]
Heap
par new generation total 9216K, used 7068K [0x00000007bec00000, 0x00000007bf600000, 0x00000007bf600000)
eden space 8192K, 80% used [0x00000007bec00000, 0x00000007bf279f40, 0x00000007bf400000)
from space 1024K, 42% used [0x00000007bf400000, 0x00000007bf46d400, 0x00000007bf500000)
to space 1024K, 0% used [0x00000007bf500000, 0x00000007bf500000, 0x00000007bf600000)
concurrent mark-sweep generation total 10240K, used 8196K [0x00000007bf600000, 0x00000007c0000000, 0x00000007c0000000)
Metaspace
used 2806K, capacity 4486K, committed 4864K, reserved 1056768K
class space used 291K, capacity 386K, committed 512K, reserved 1048576K
G1(Gerbage First Collector)(目前被主流使用)
从JDK9开始,G1已经成为了默认的垃圾收集器。
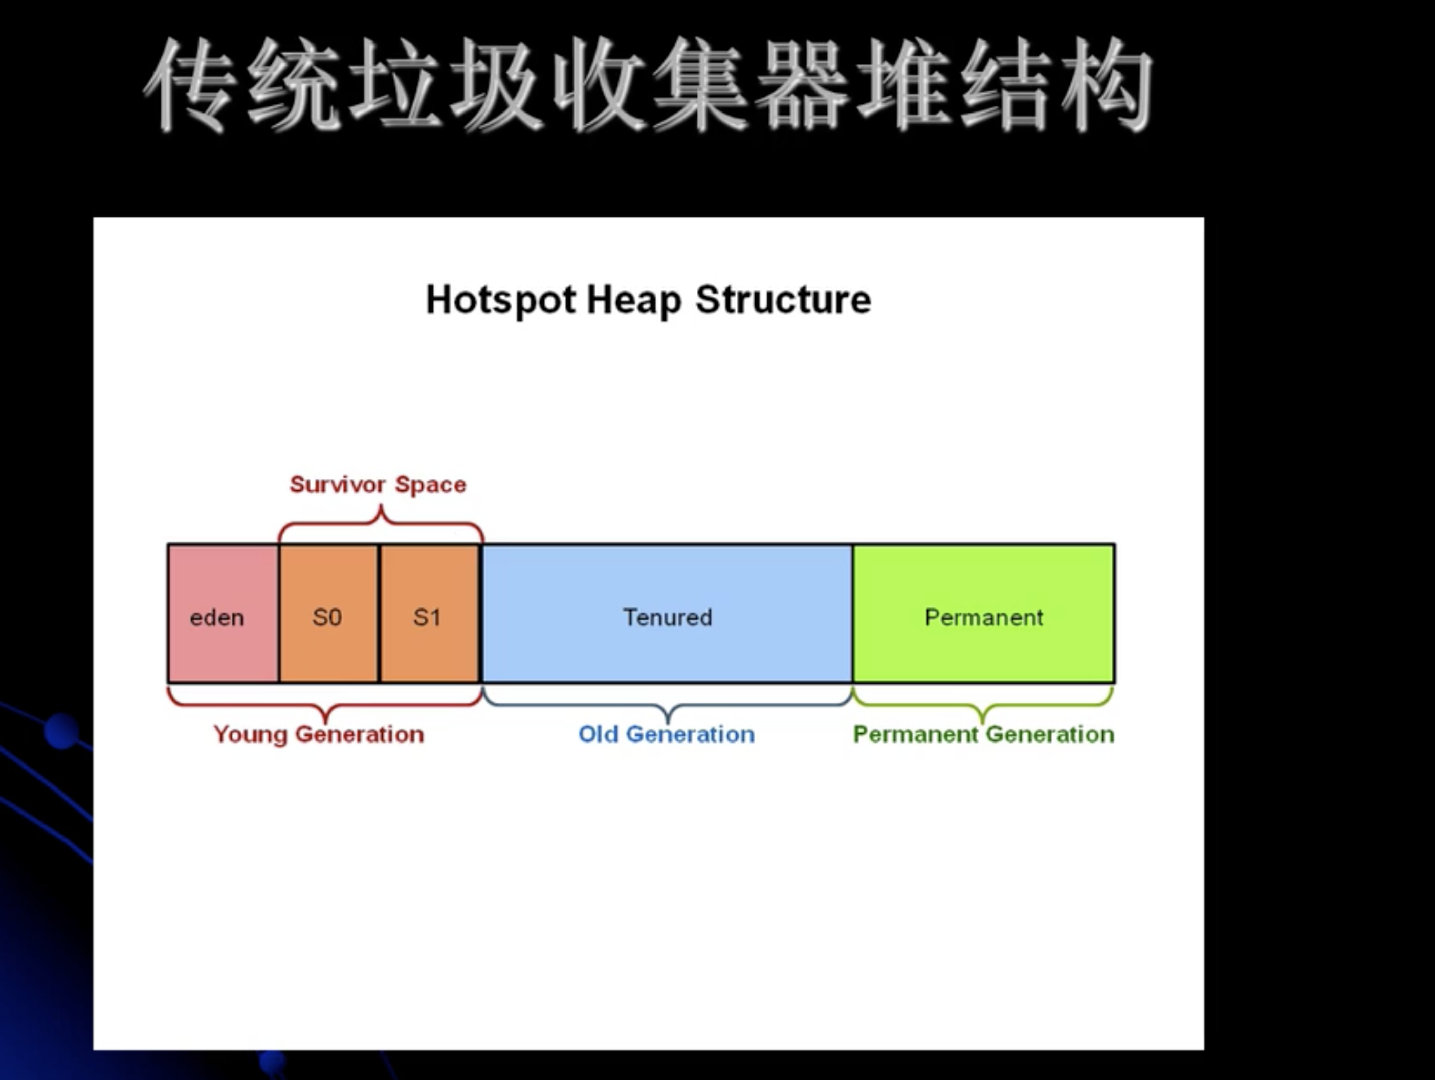
物理内存中的新生代与老年代被消除。
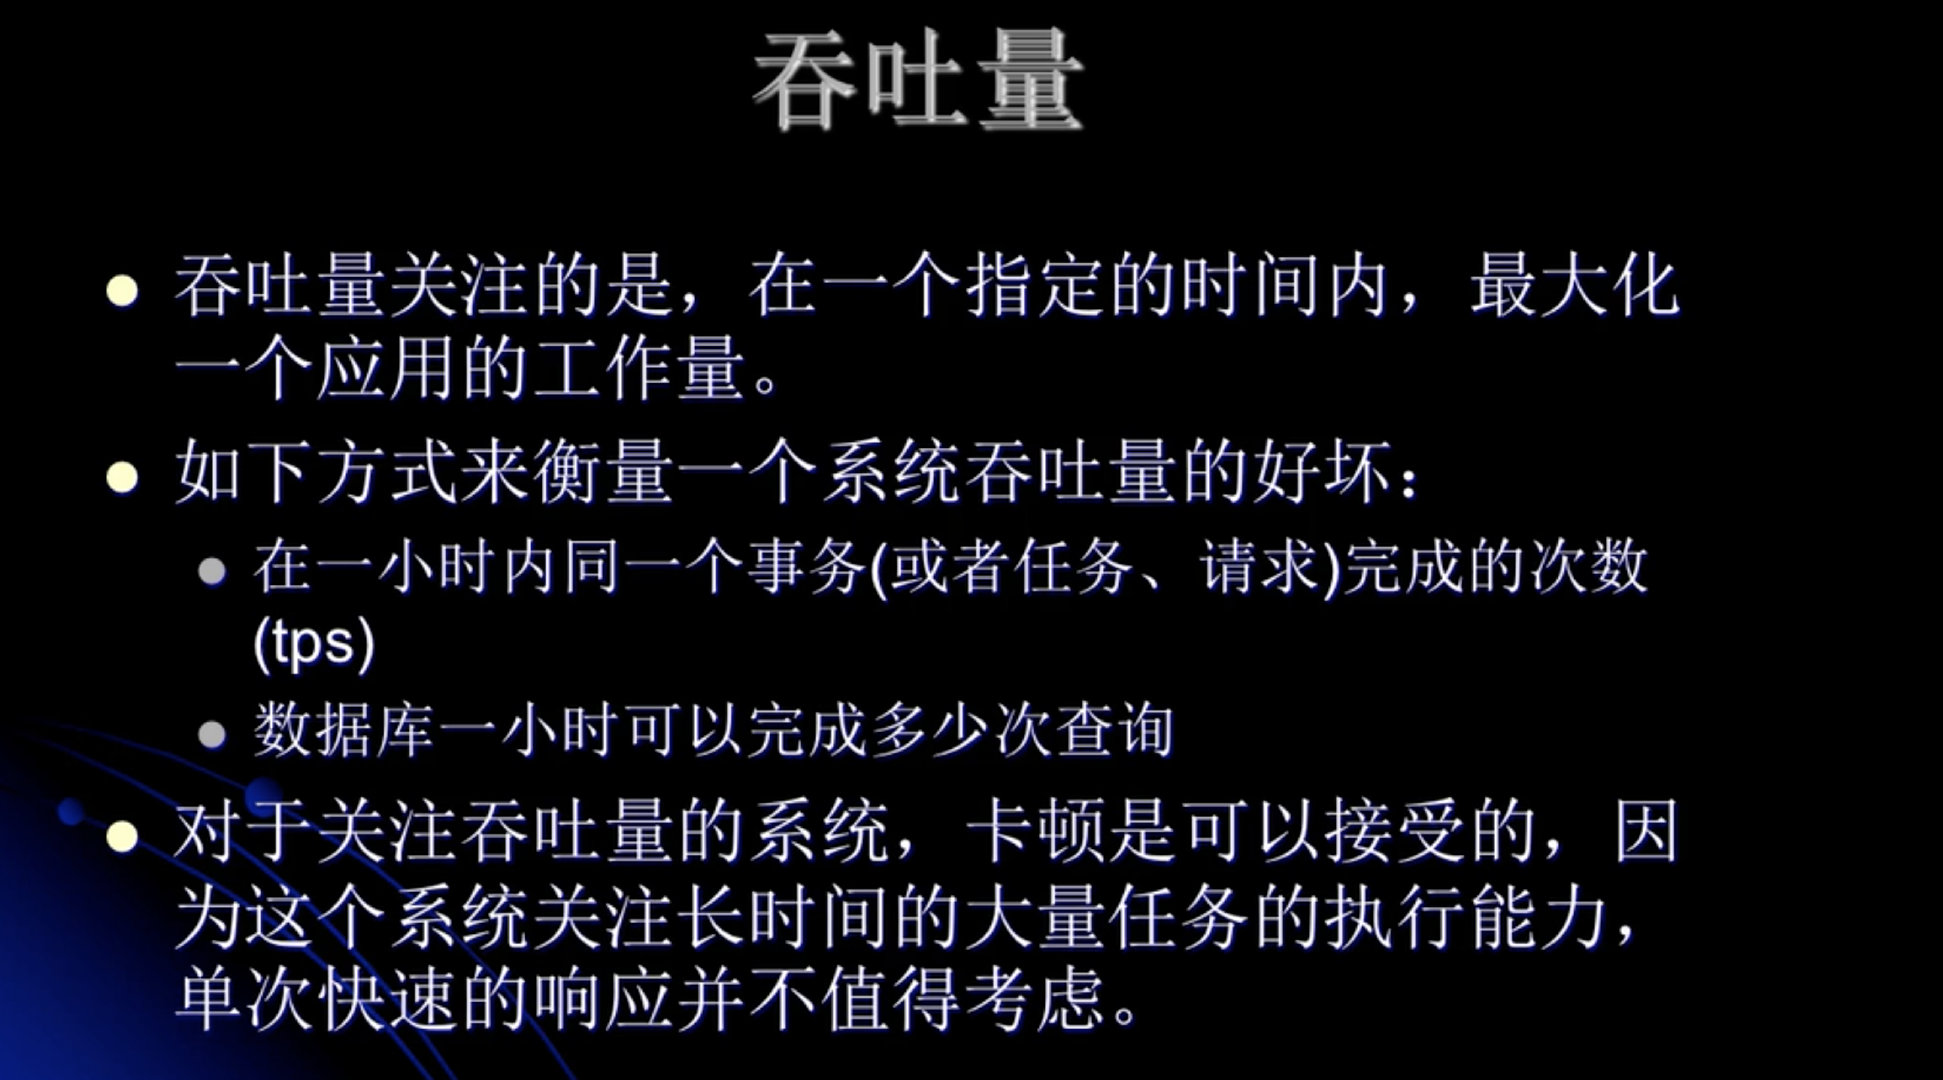
系统吞吐量几个重要参数:QPS(TPS)、并发数、响应时间
QPS(TPS):每秒钟request/事务 数量
并发数: 系统同时处理的request/事务数
响应时间: 一般取平均响应时间
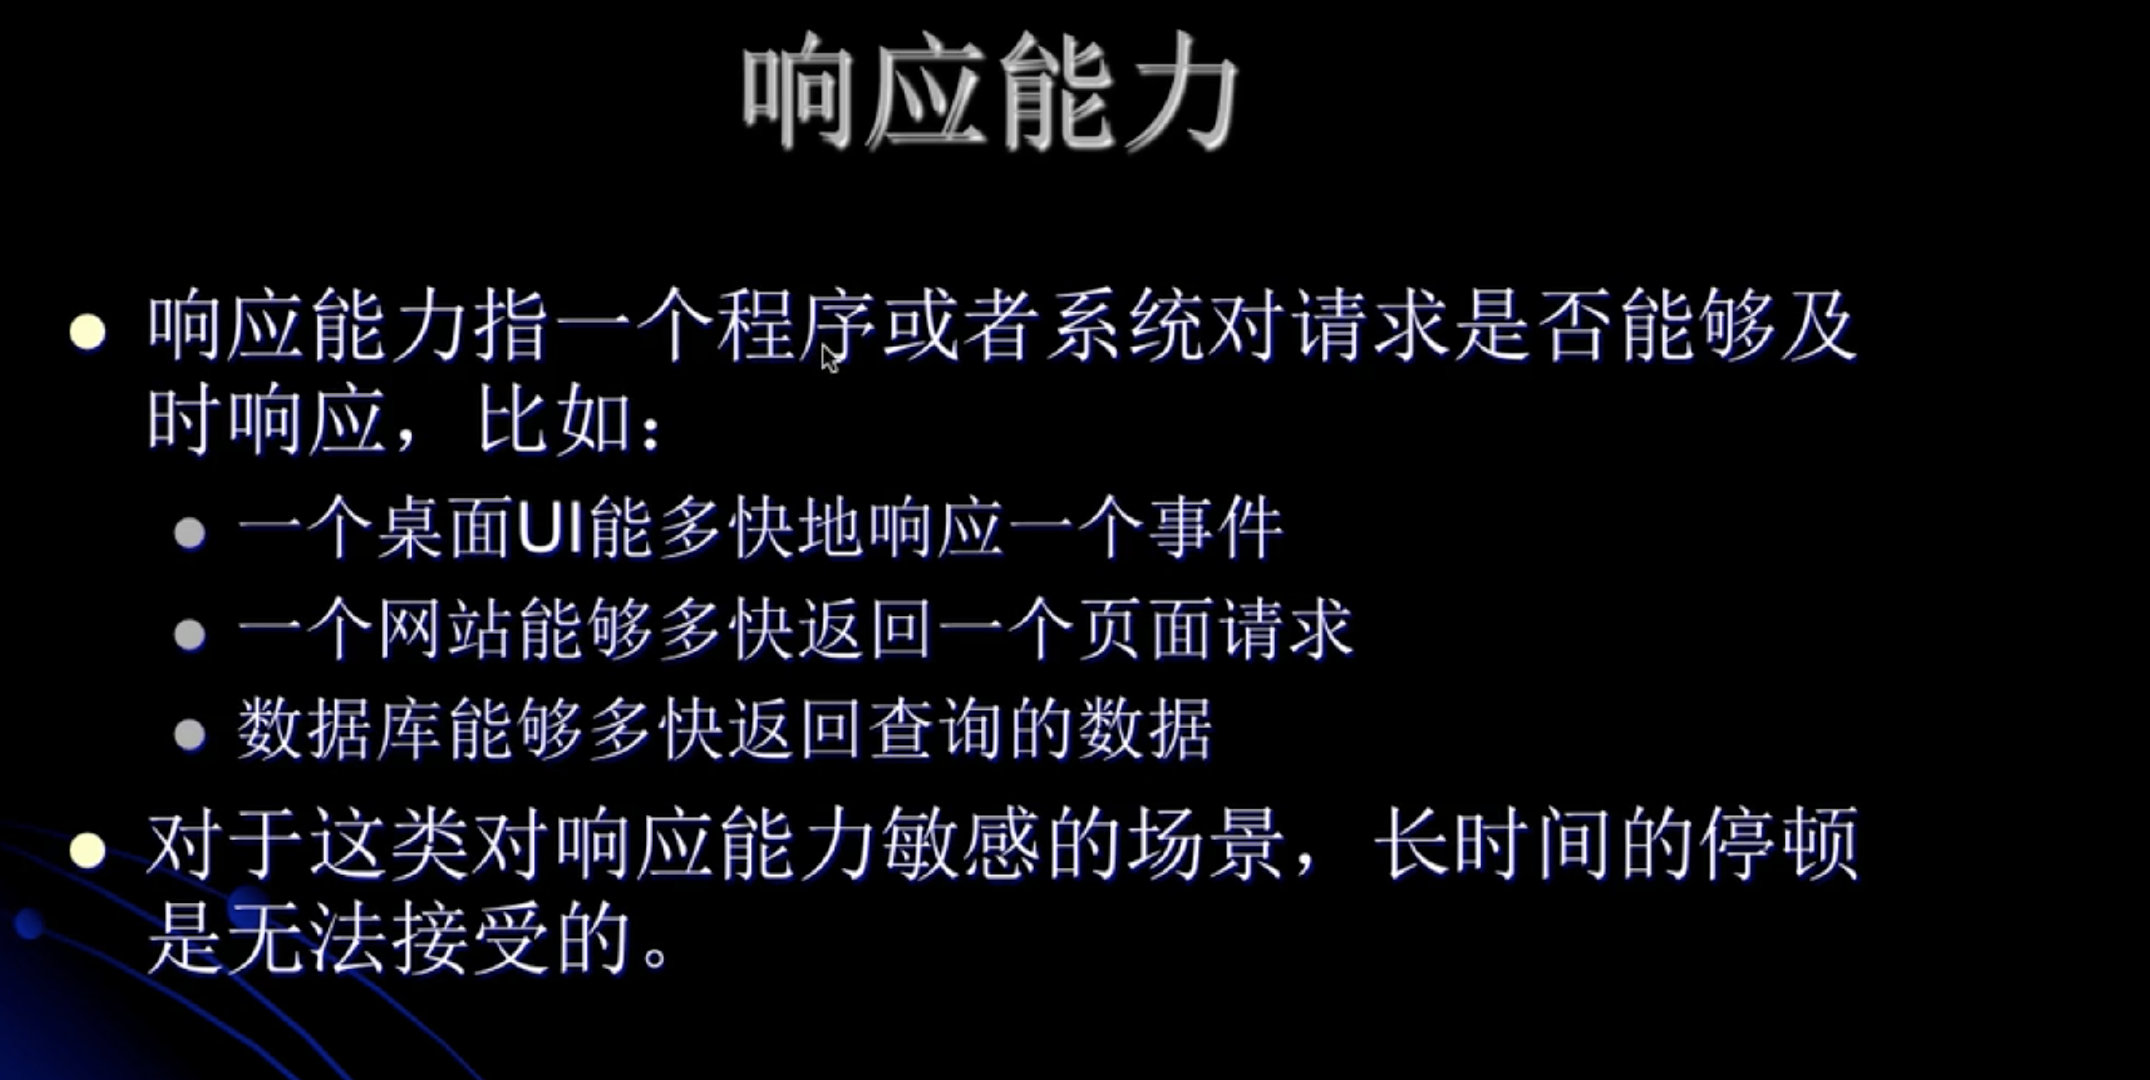
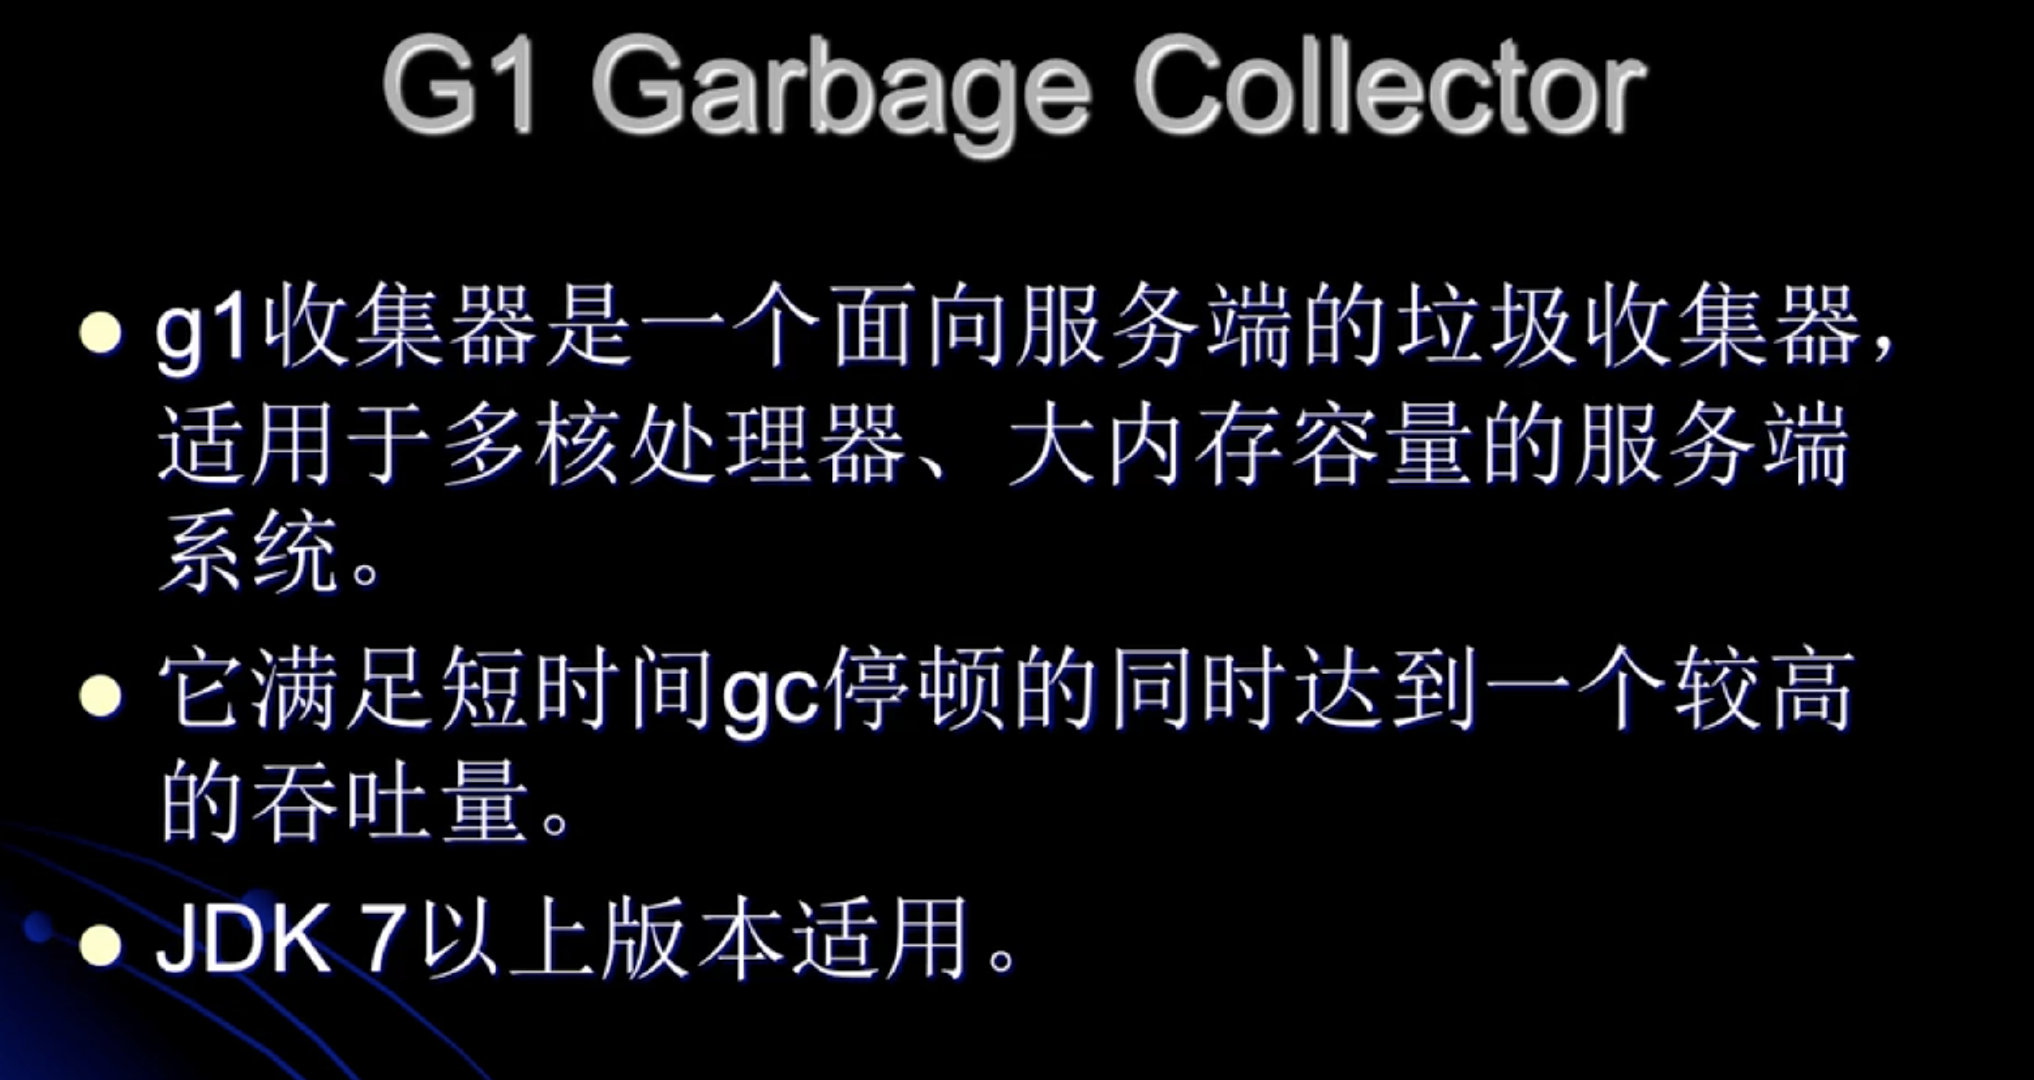
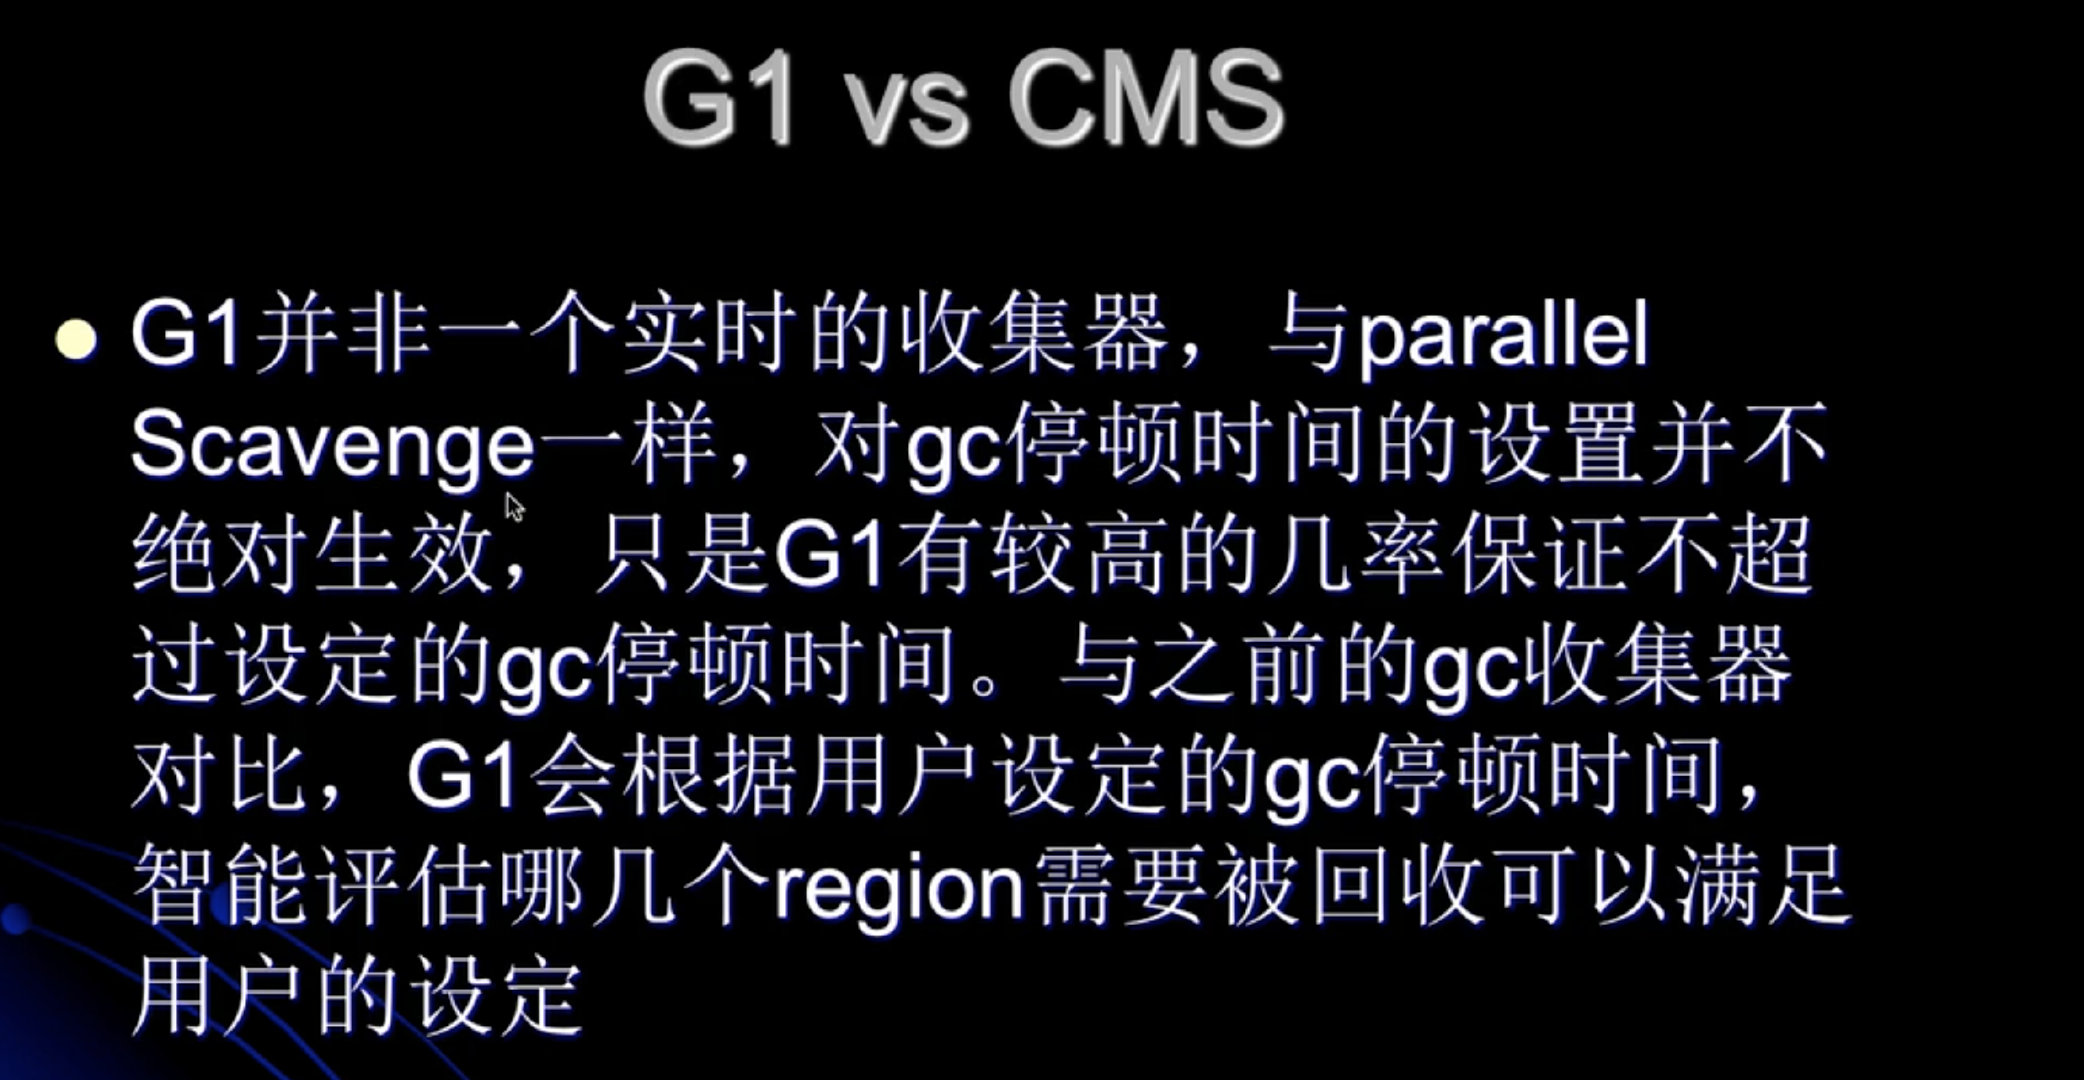
G1有很好的吞吐量和响应能力。
G1收集器的设计目标
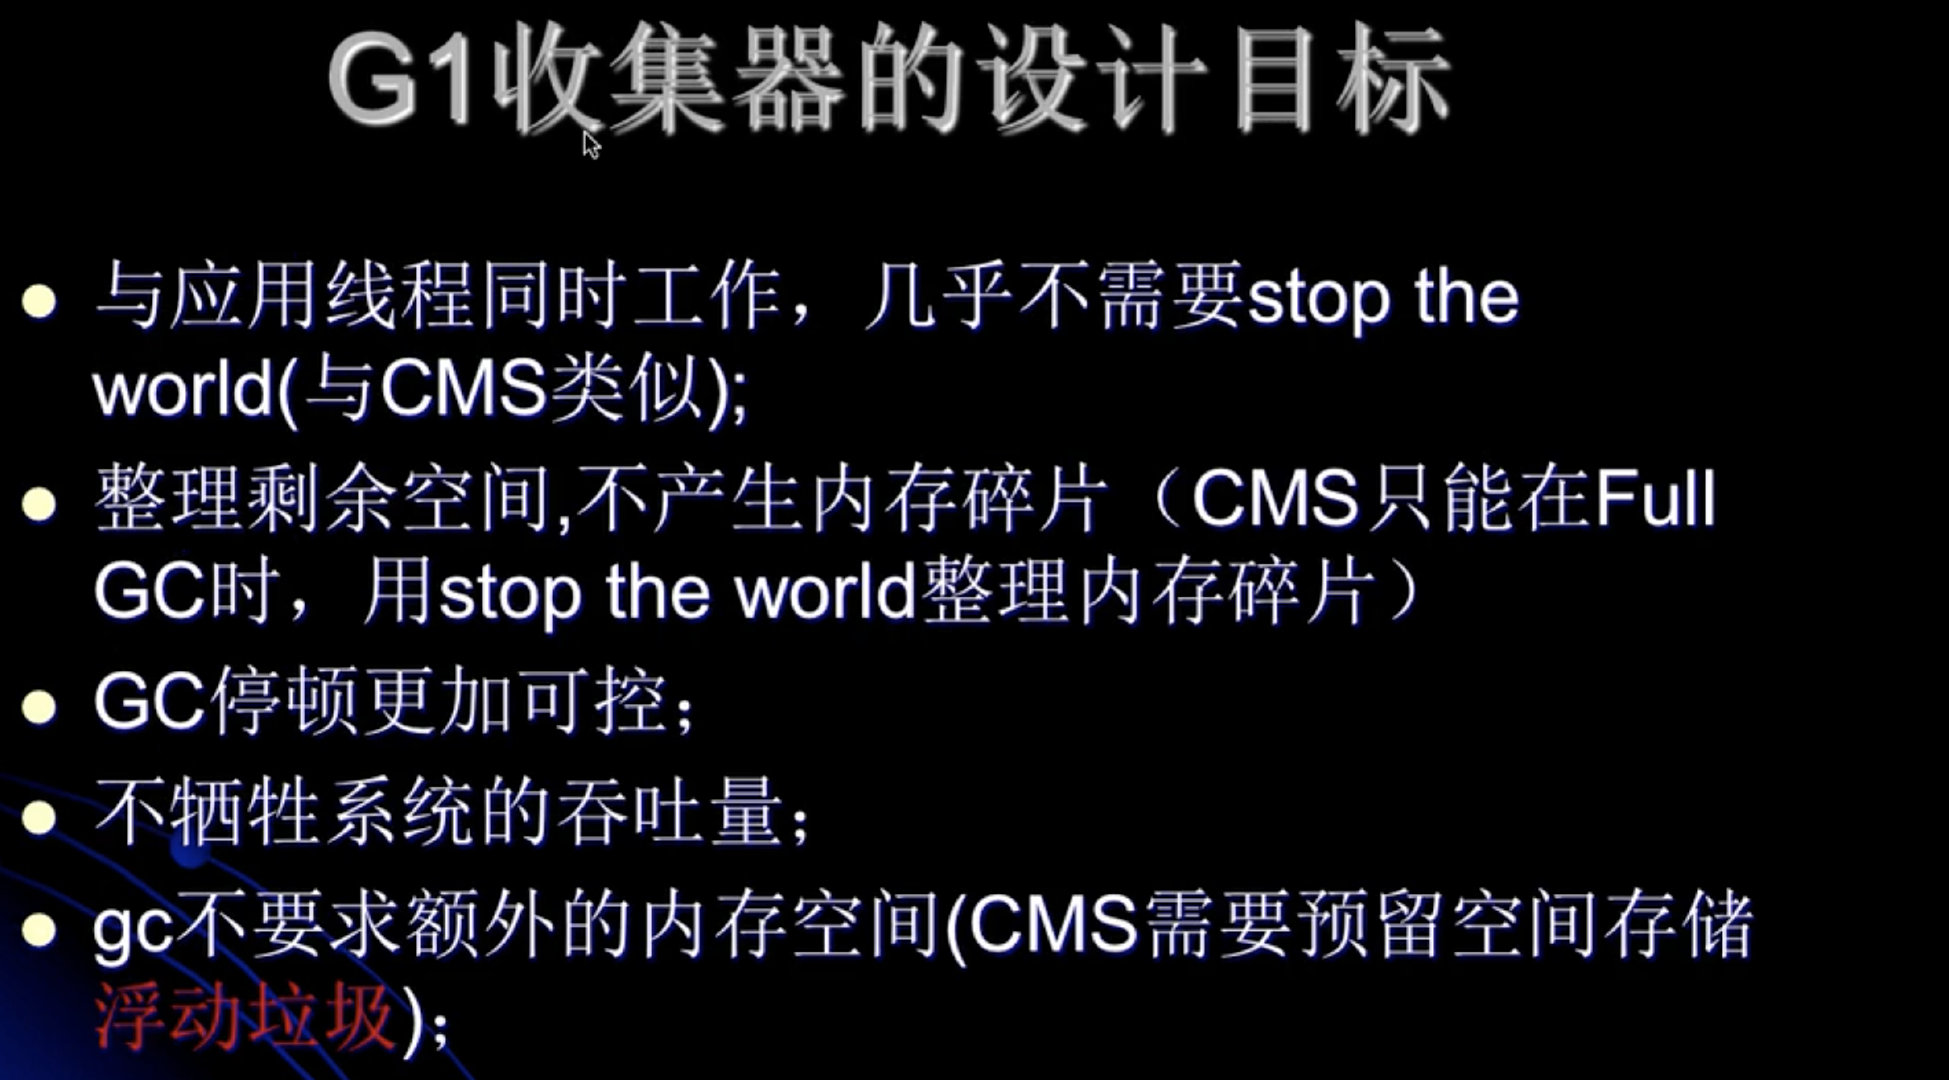
强调: GC停顿时间更加可控。
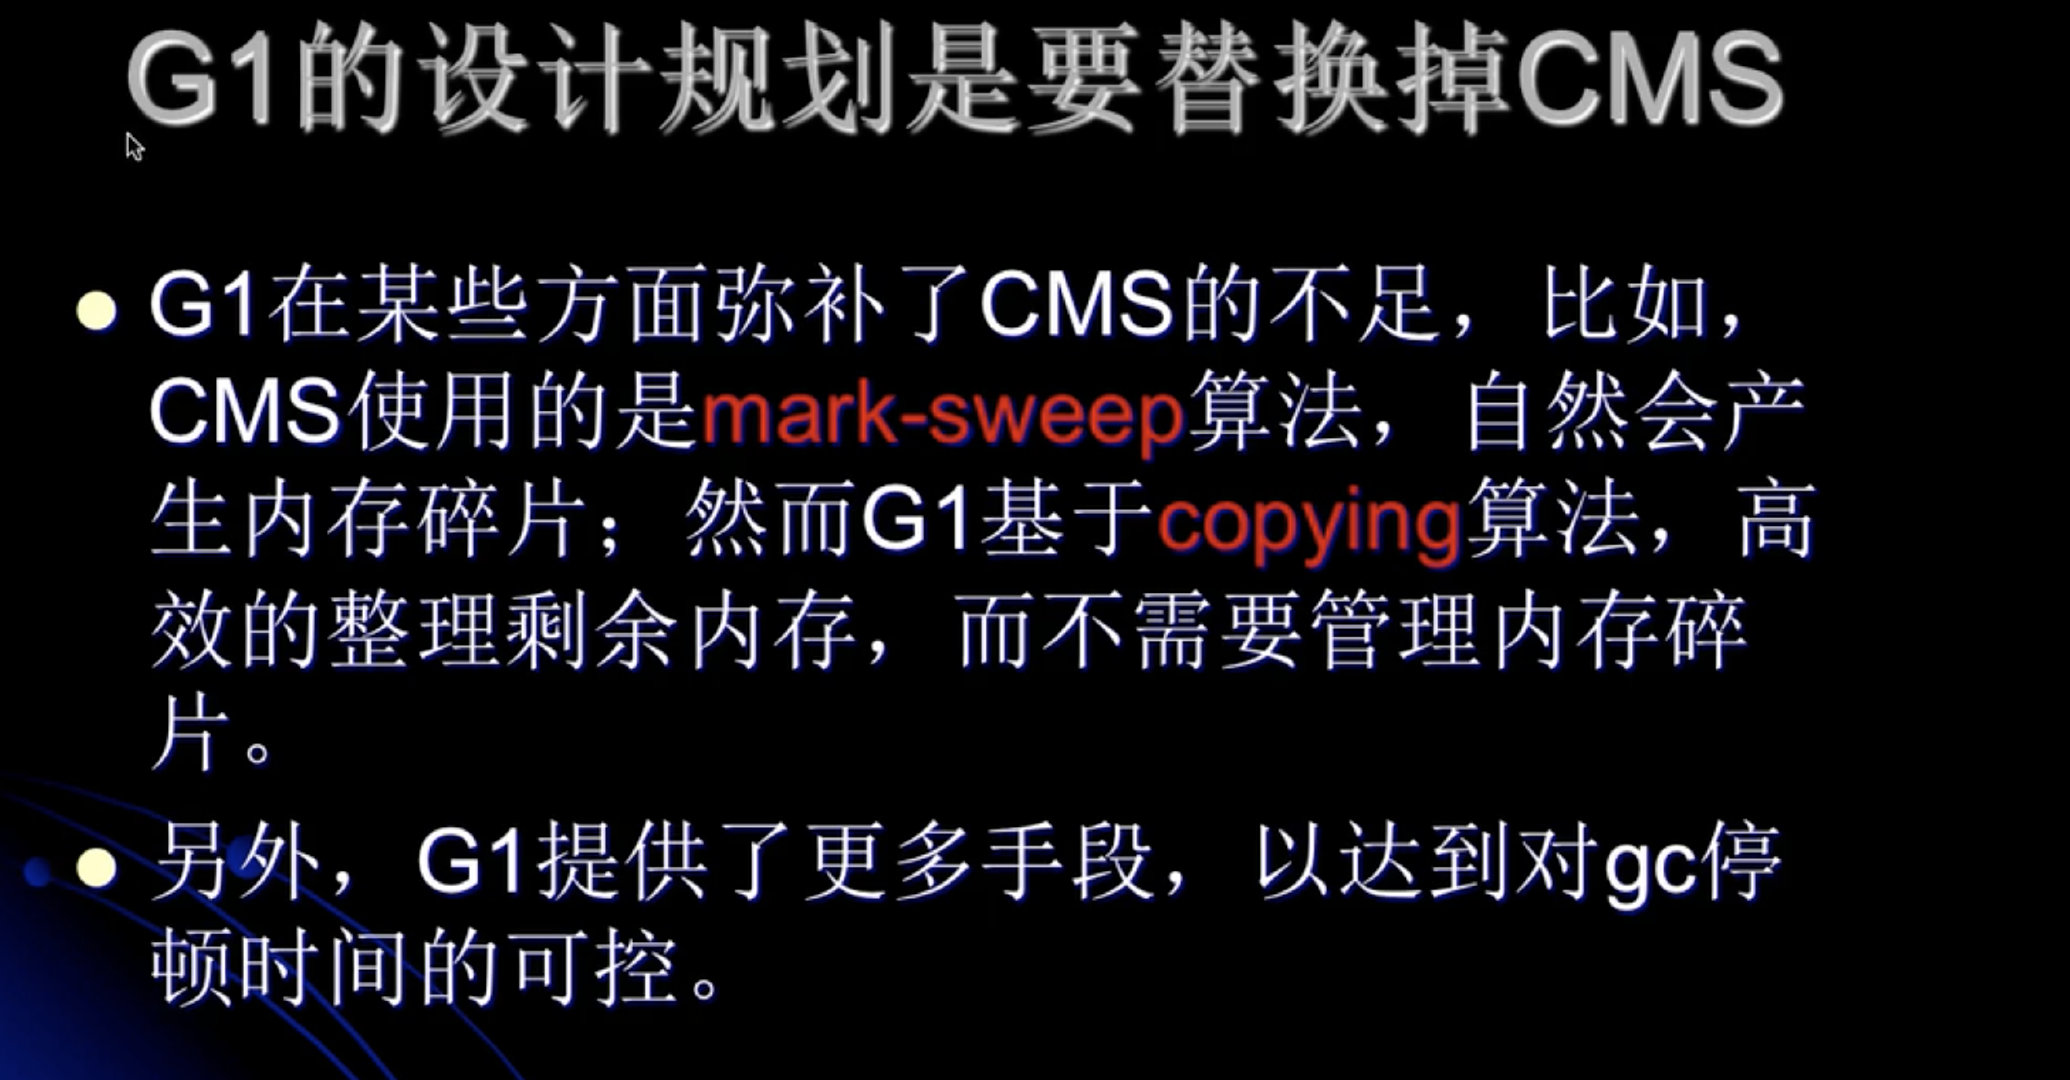
G1可以回收部分老年代,CMS要回收全部的老年代。
所以说G1在停顿时间上更可控。
哇,竟然都学过了。图中的内容也都知道,但是刚拿到这个图的时候不敢去看他。
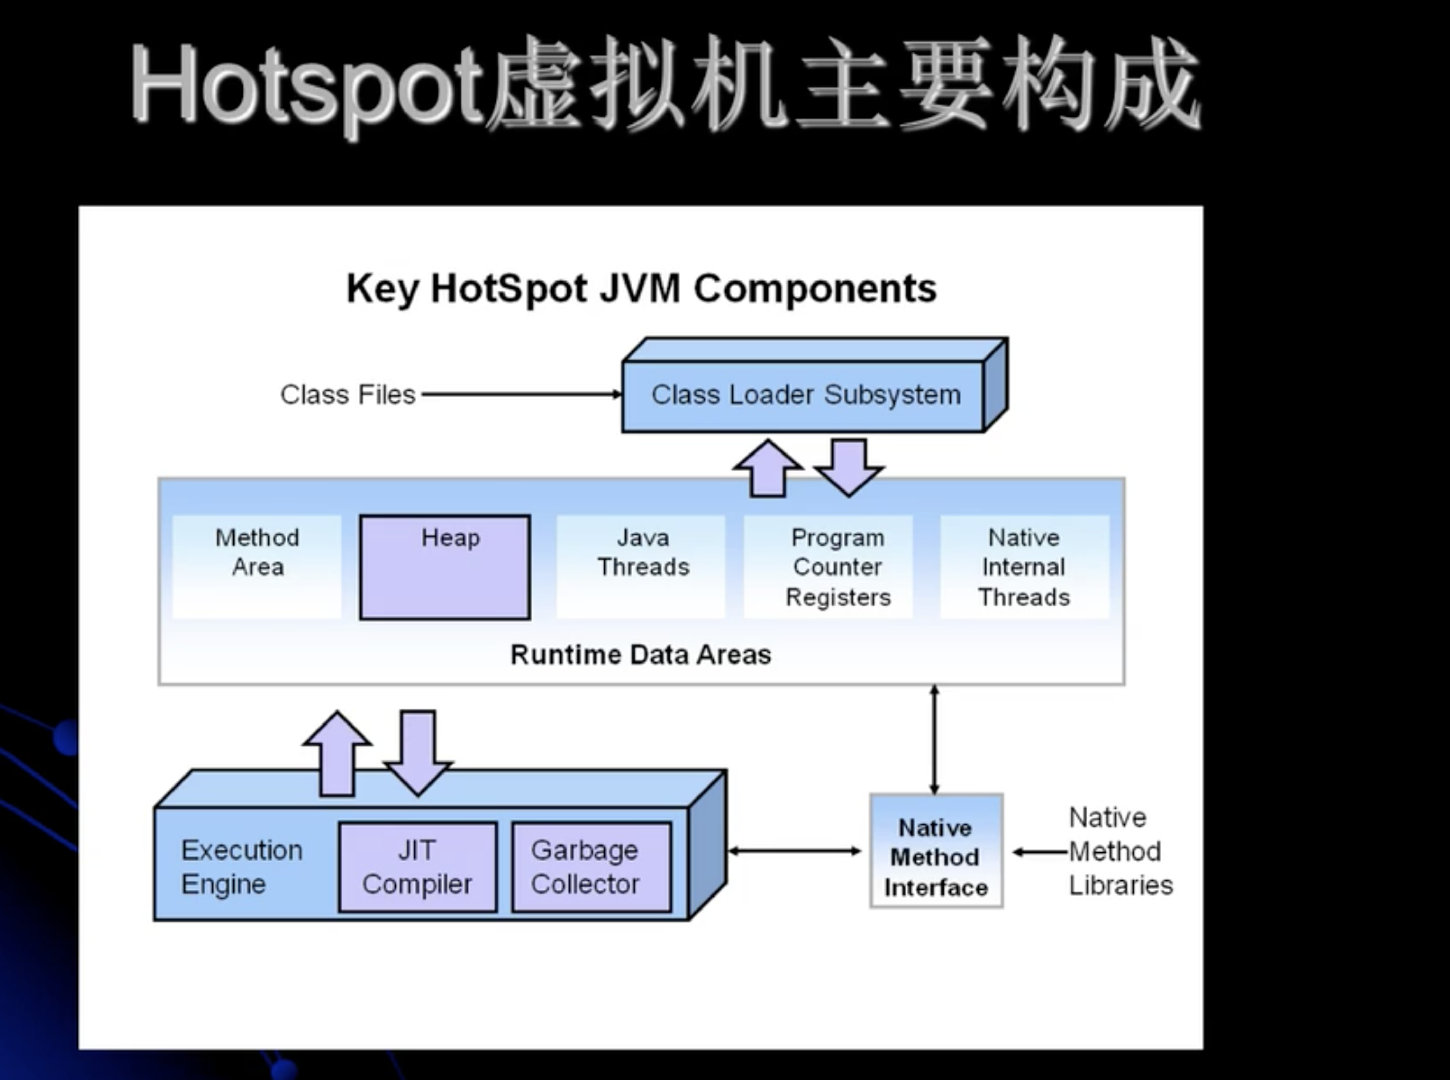
execution engine : 执行引擎
JIT compiler :即时编译器。
internal : 内部的 native : 本地的
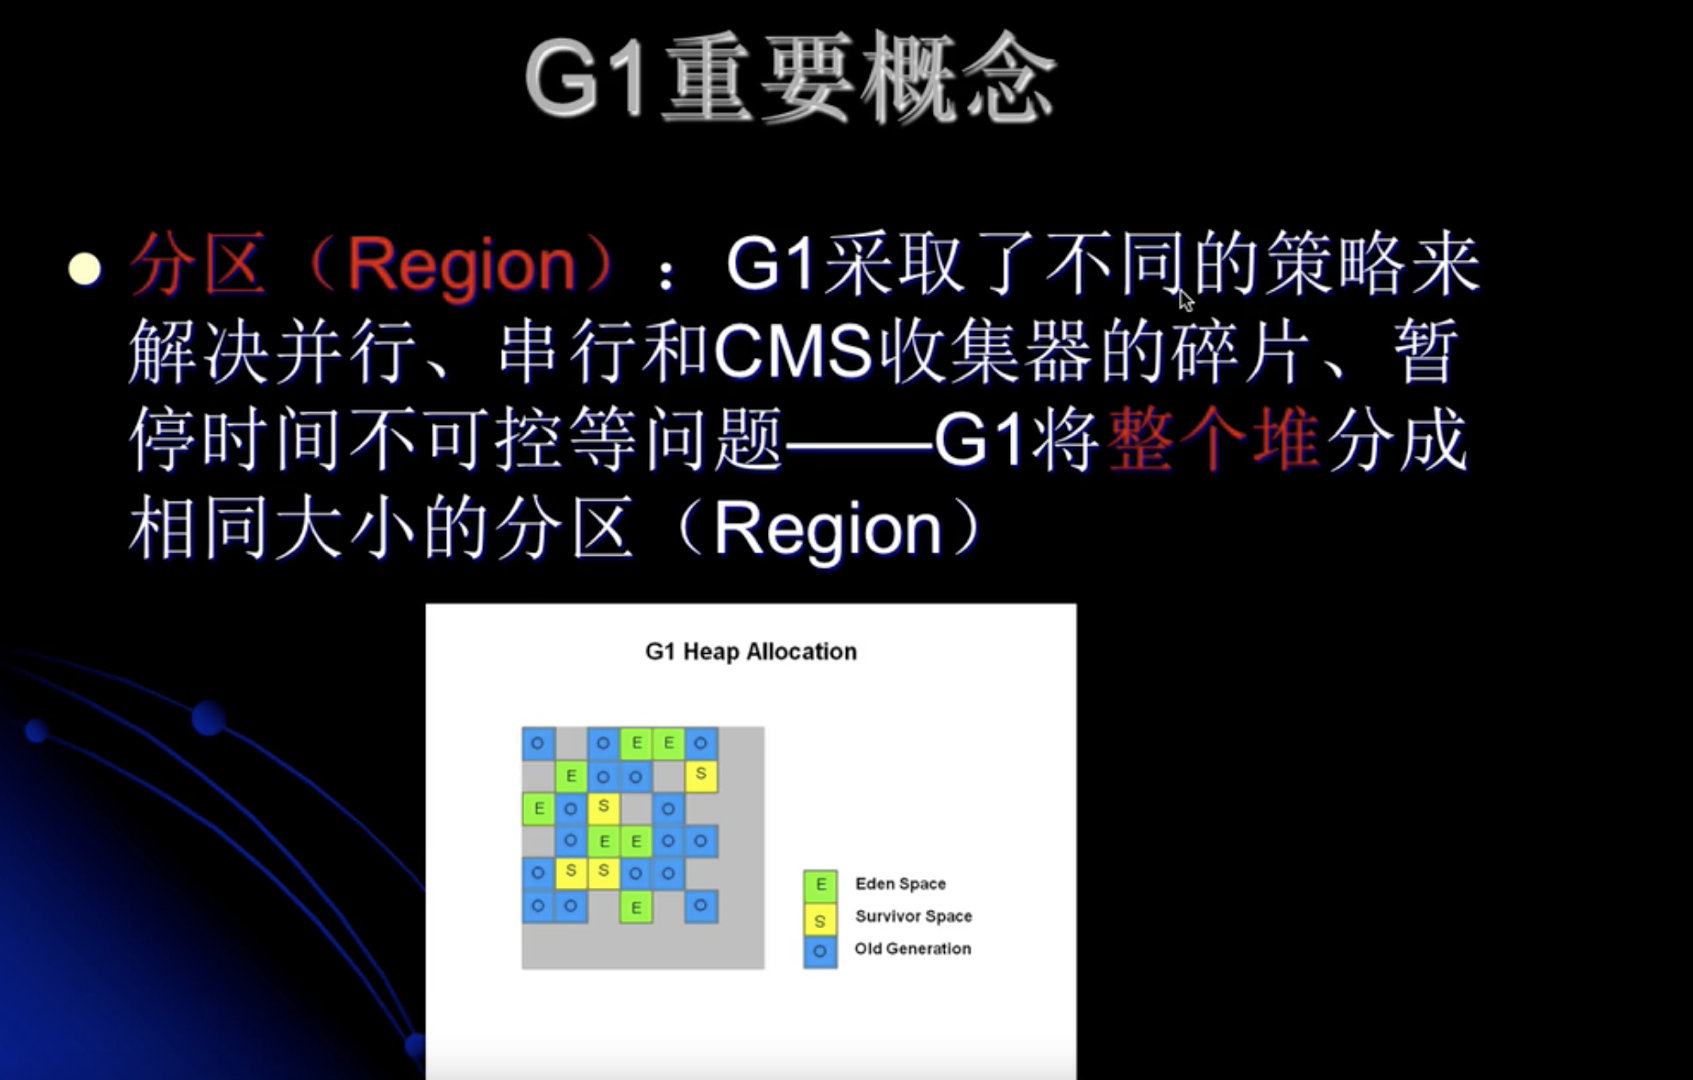
G1收集器堆结构划分
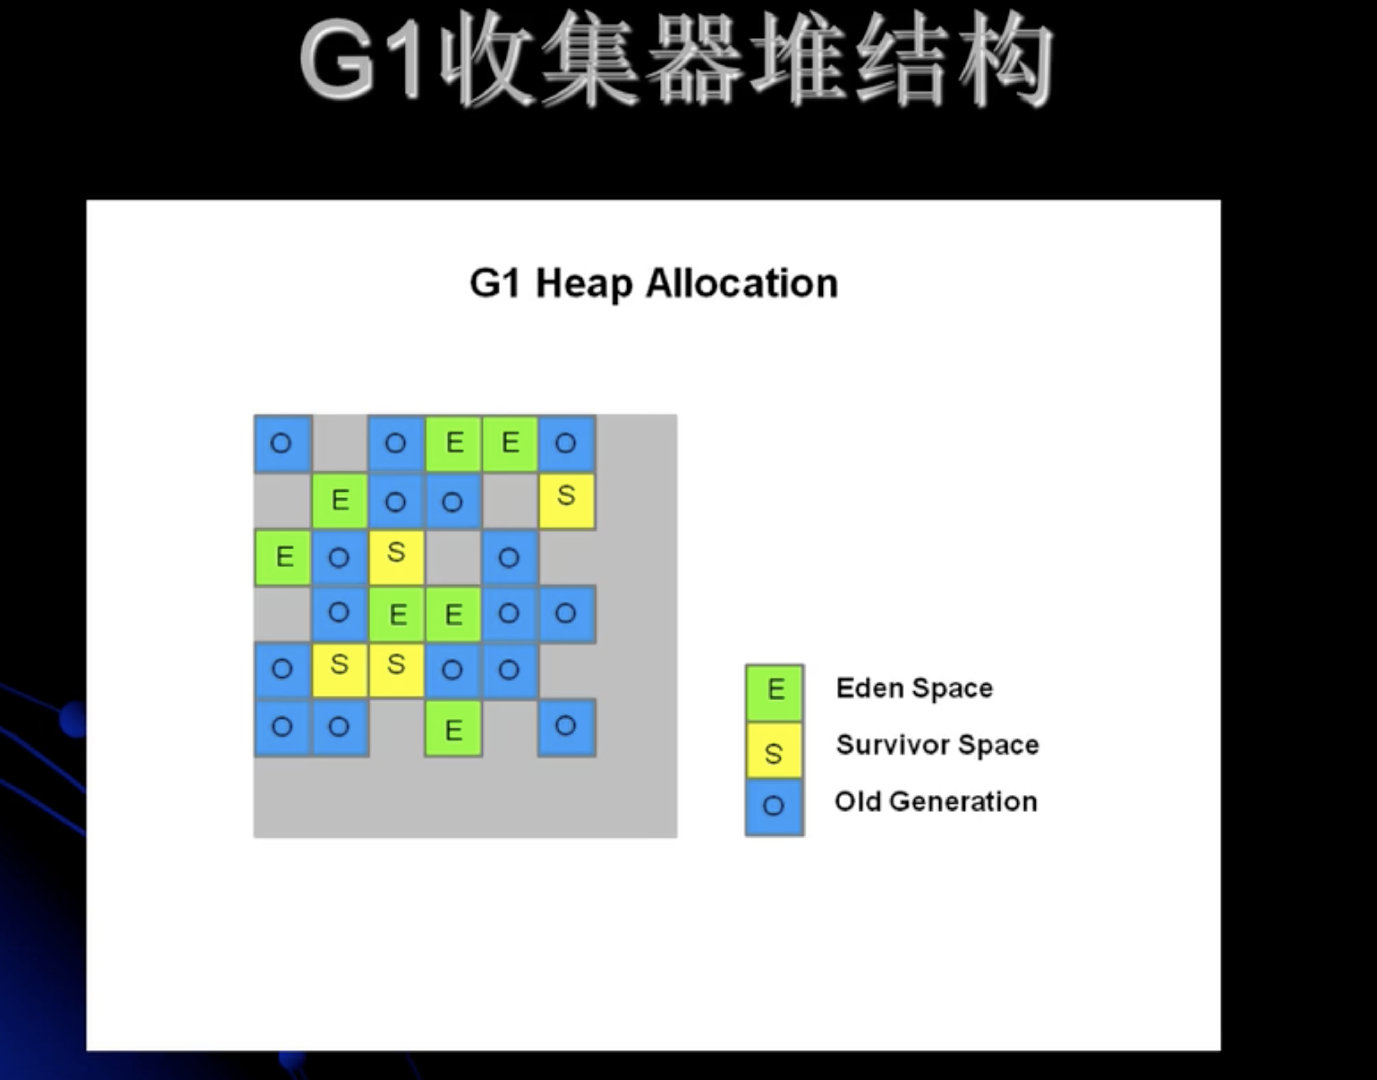
整个堆空间,不做块的区分。就当成是一个堆空间。每一个空间的使用情况都可能是三种情况之一。
对每种分代内存的大小,可以动态变化。

G1 vs CMS
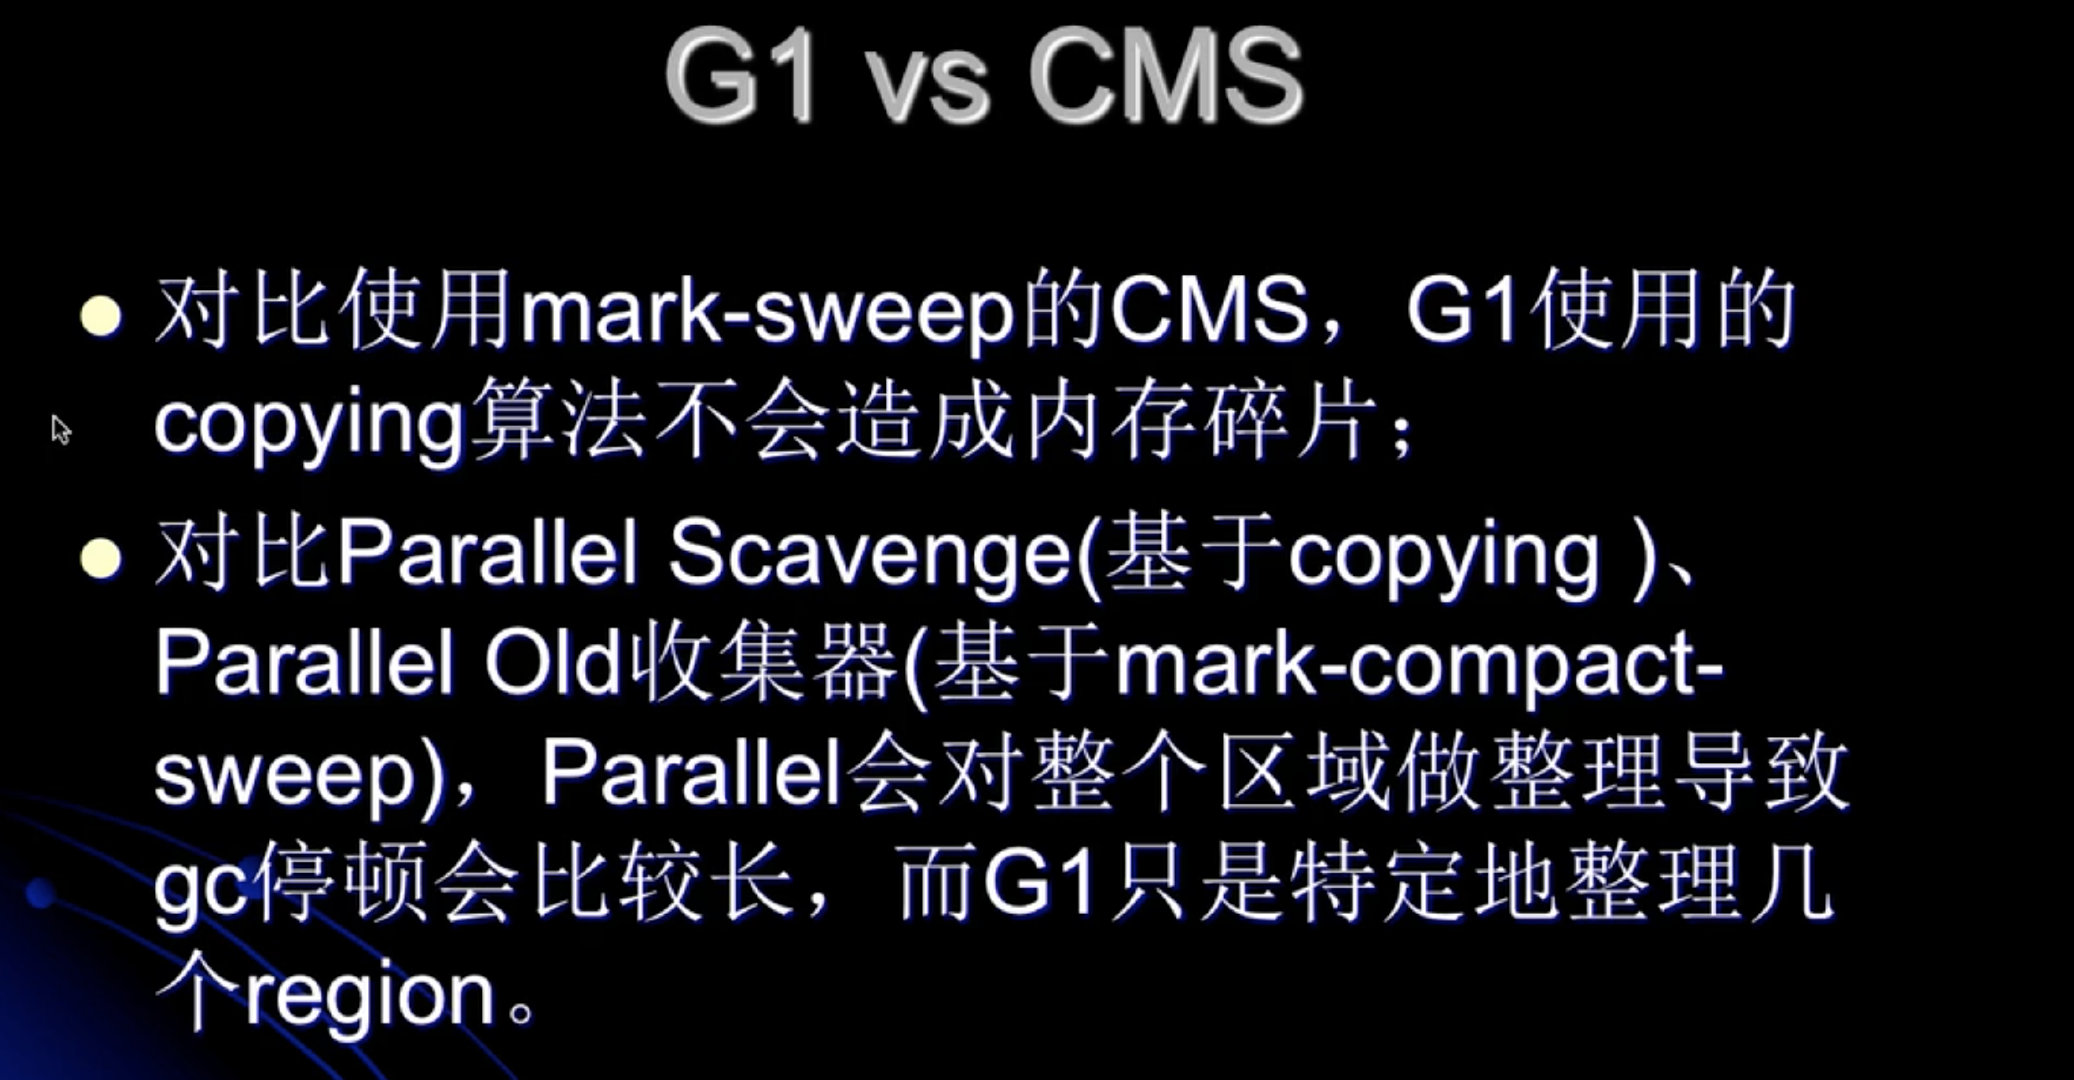
这些差异,源于G1对物理模型设计的变化。
G1重要概念
分区(Region)
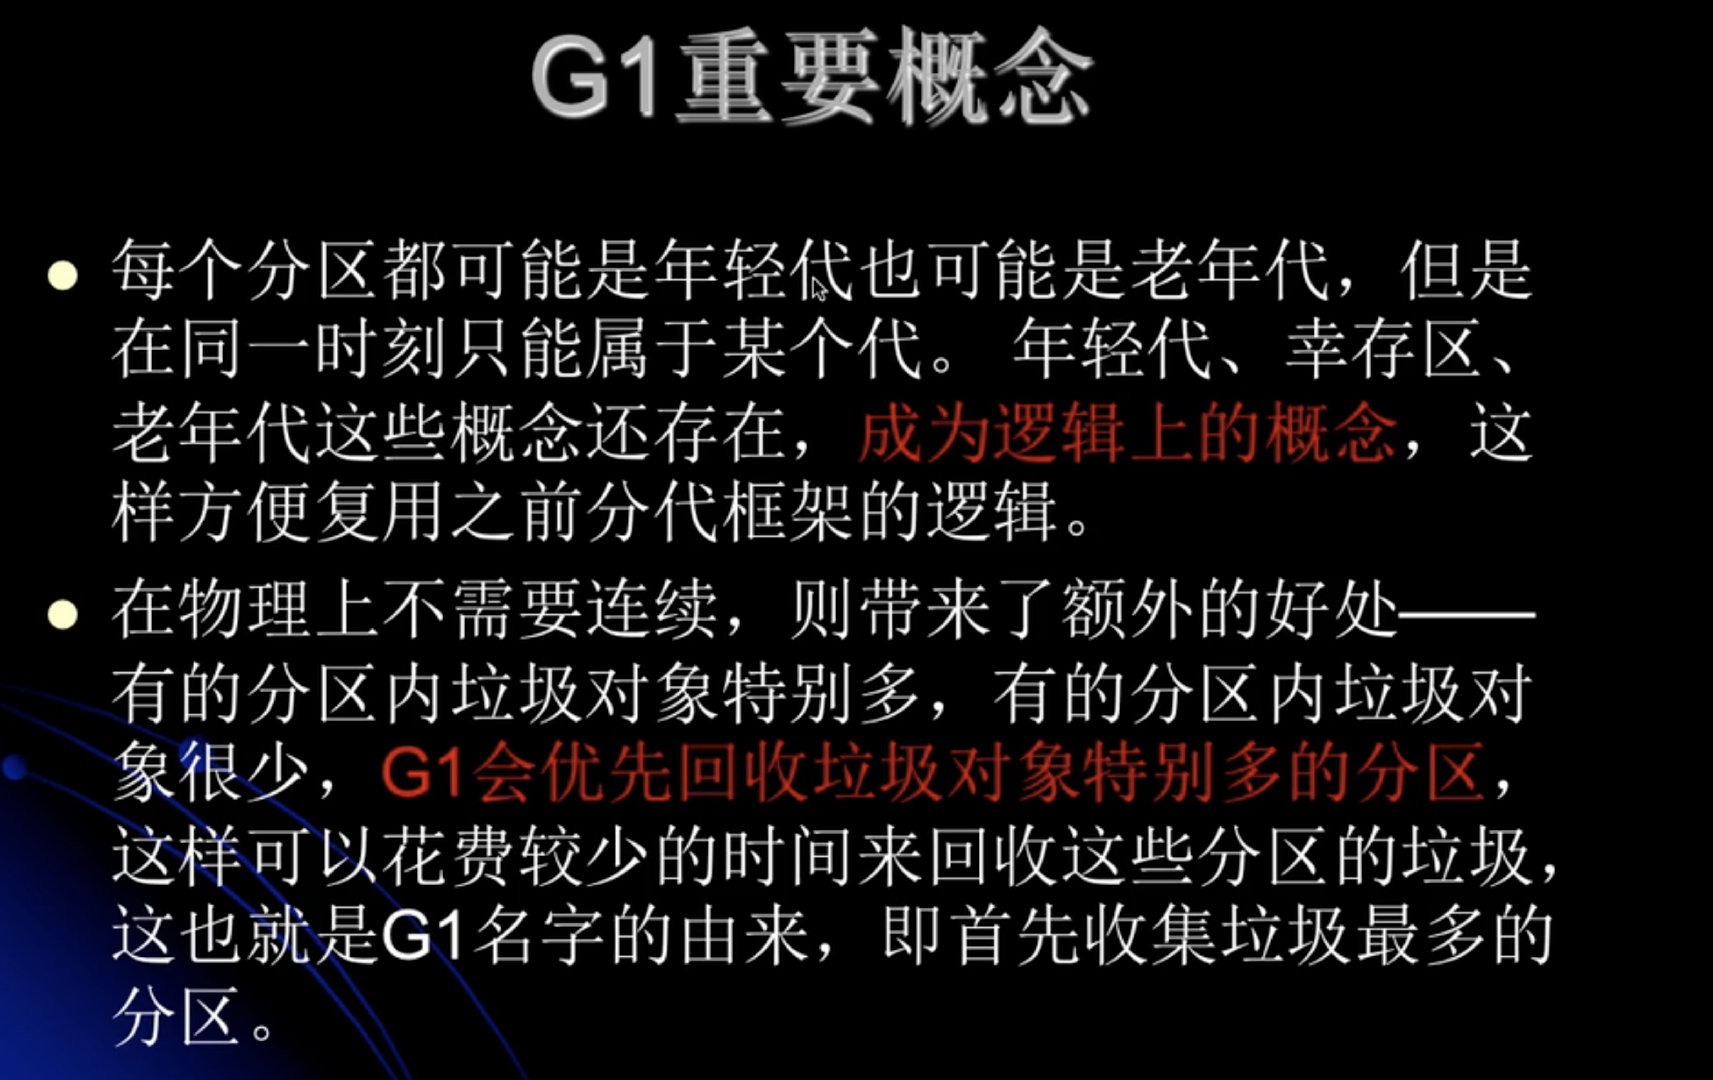
G1 : 垃圾优先。 即首先收集垃圾最多的分区。

新生代满的时候,G1 对整个新生代进行回收。

收集集合(CSet)
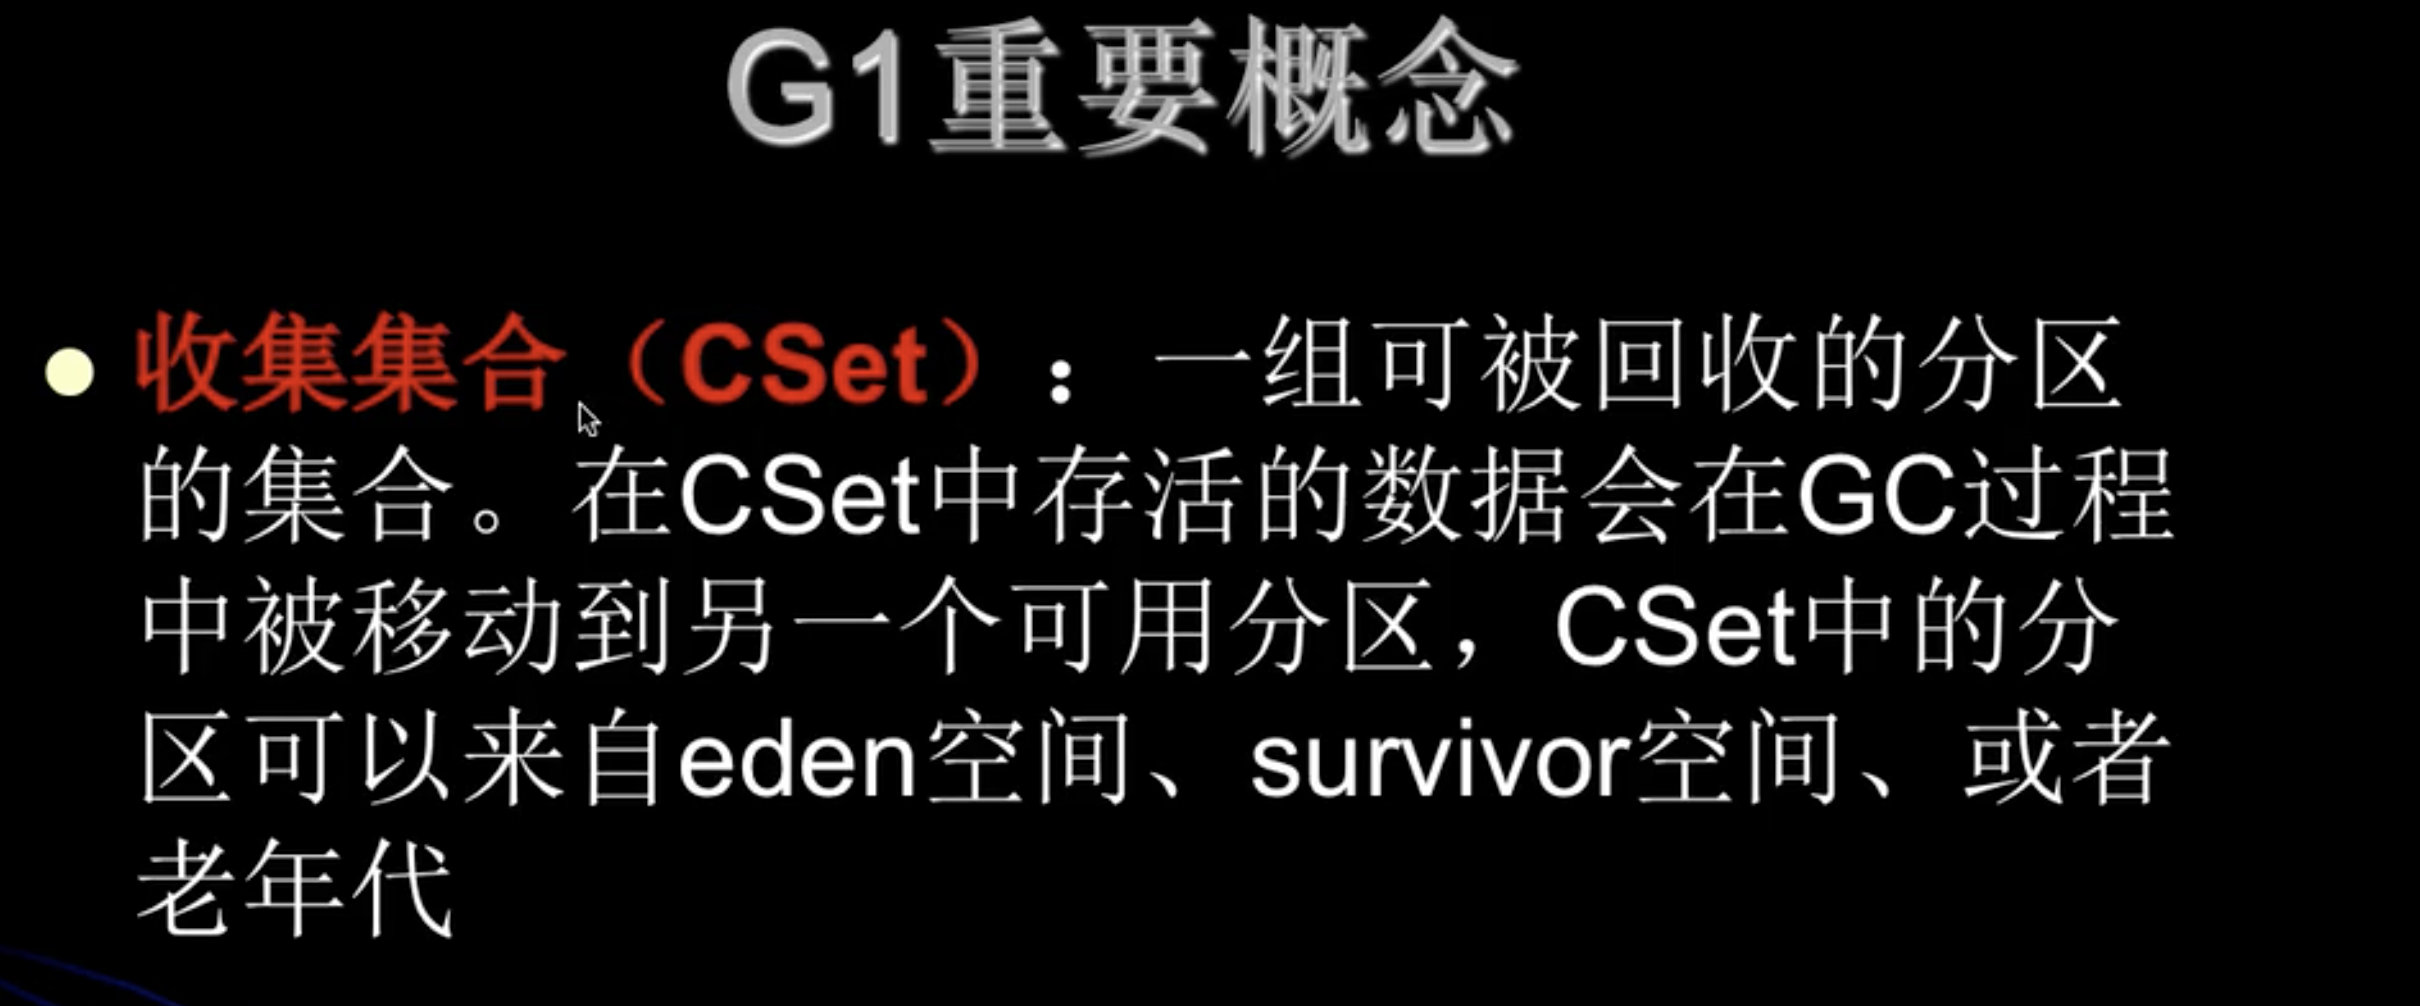
CSet:一组将要被回收的空间的集合。
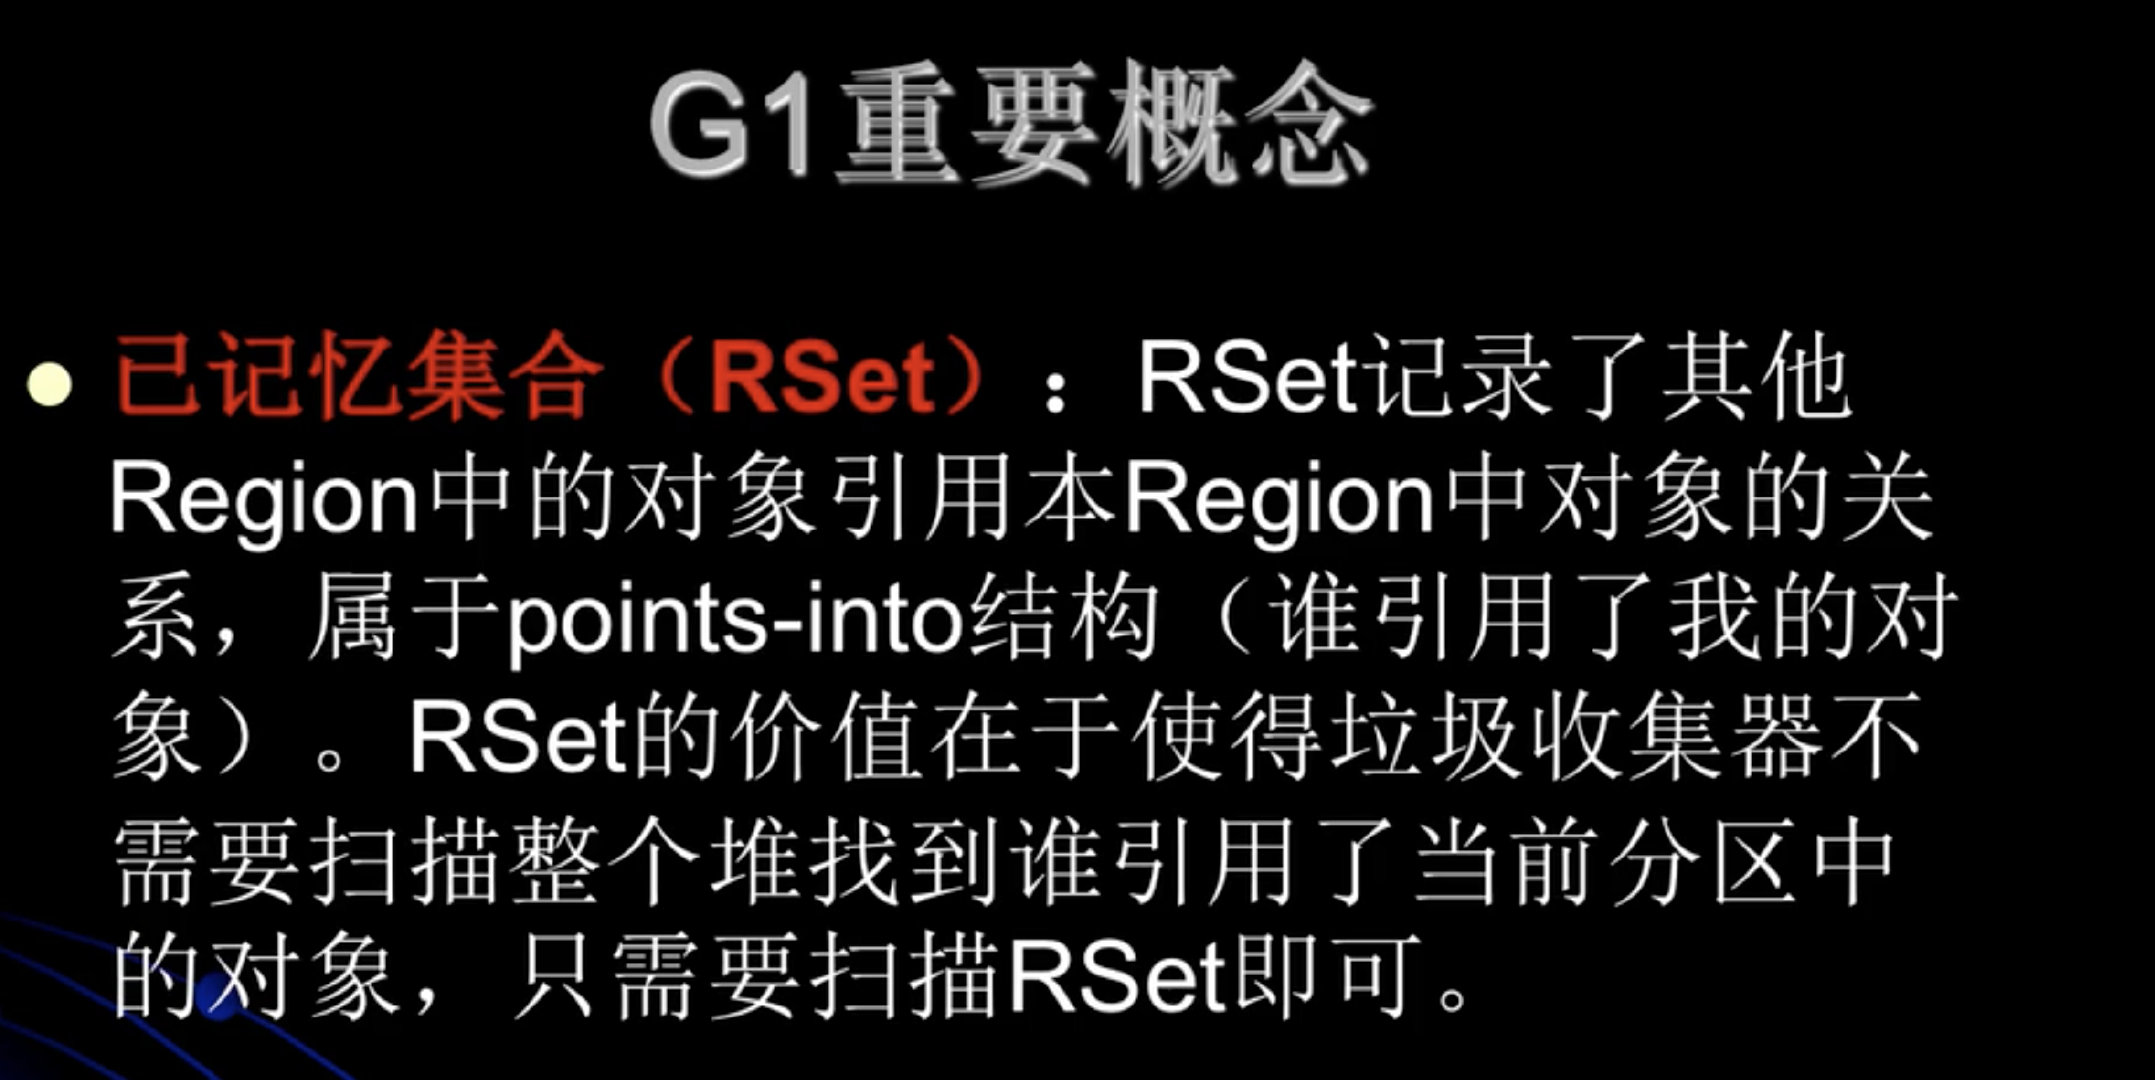
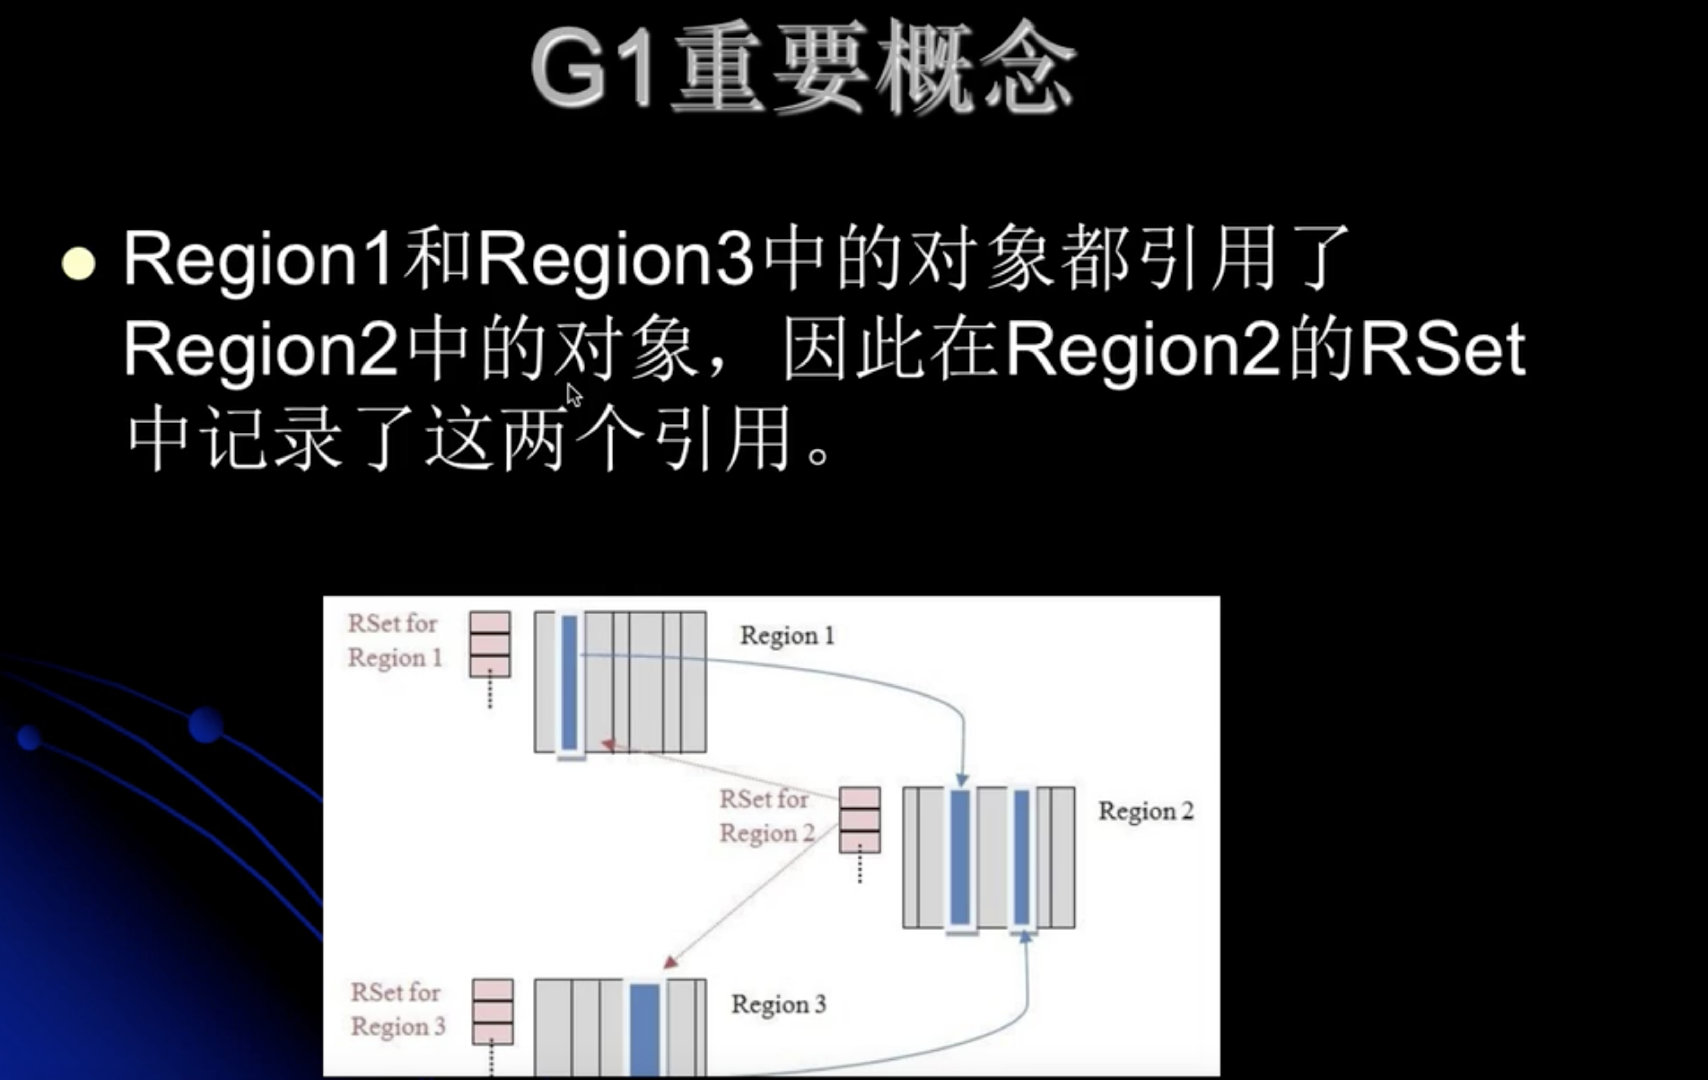
已记忆集合(RSet)